


Talking Points:
- Gold prices mark time as US tax cut prospects continue to be in focus
- Crude oil prices test Nov. high as Saudi exports, US inventories drop
- What do retail traders’ bets say about the gold trend? Find out here
Gold prices are treading water in familiar territory, shrugging off a speech from Fed Chair Janet Yellen that offered nothing particularly novel. Minutes from this month’s FOMC meeting are now on tap. The document is likely to set the stage for a rate hike in December, but that outcome is already so widely expected that the release may not mean much for price action.
Rather, fiscal policy continues to be the central object of speculation as markets focus on the projected rate hike path for 2018. That puts the Congressional debate about tax reform in the spotlight. Senators continue to haggle over a single vision for legislation that would then need to be reconciled with a proposal passed in the House of Representatives. Signs that the effort has hit a wall are likely to boost the yellow metal.
Crude oil prices rose amid news that Saudi Arabia cut crude exports to the lowest level in 6.5 years in September while API reported that US inventories shed a whopping 6.3 million barrels last week. The analogous set of official figures from the EIA is expected to show a more modest 1.43 million barrel draw. A print closer to the API projection may offer prices a further boost.
What are the forces driving long-term crude oil price trends? See our guide to find out!
GOLD TECHNICAL ANALYSIS – Gold prices continue to mark time above support at 1269.10, the 38.2% Fibonacci expansion. A daily close below that exposes the 1257.69-60.80 area (October 6 low, 50% expansion). Alternatively, a push above the 38.2% Fib retracement at 1297.74 targets the 1306.04-9.15 zone (October 16 high, 50% retracement).
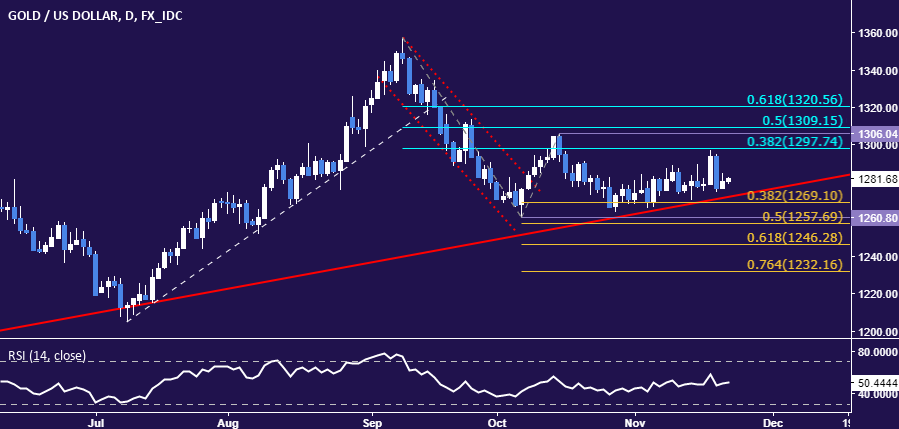
Chart created using TradingView
CRUDE OIL TECHNICAL ANALYSIS – Crude oil prices are testing monthly highs once again. A daily close above the 57.72-92 area (23.6% Fibonacci expansion, November 8 high) opens the door for a test of the 38.2% level at 59.52. Alternatively, a move back below the 14.6% expansion at 56.51 targets the 23.6% Fib retracement at 55.01.

Chart created using TradingView
--- Written by Ilya Spivak, Currency Strategist for DailyFX.com
To receive Ilya's analysis directly via email, please SIGN UP HERE
Contact and follow Ilya on Twitter: @IlyaSpivak


