


Talking Points:
- Crude oil prices look to API inventory figures for fresh direction cues
- Gold prices slump back to range floor, eye Yellen speech for guidance
- How are DailyFX Q4crude oil, gold forecasts faring? Find out here
Crude oil prices paused to consolidate amid a lull in top-tier news flow, as expected. The weekly API inventory flow report is now in focus. Official EIA statistics due on Wednesday ae expected to show a 1.7 million barrel drawdown and this release will be judged against that baseline. A larger outflow is likely to boost prices while a smaller one (or even an unexpected build) are likely to send them downward.
Gold prices turned lower as markets digested risk aversion triggered Friday following news that Special Counsel Robert Mueller subpoenaed the Trump campaign. A speech from Fed Chair Janet Yellen is now in focus. She might be more candid having announced her departure from the central bank after Jerome Powell takes over in February and traders will keen to glean any new insights about the 2018 policy outlook.
What are the forces driving long-term crude oil price trends? See our free guide to find out!
GOLD TECHNICAL ANALYSIS – Gold prices slumped back into a familiar congestion range after testing resistance near 1297.74, the 38.2% Fibonacci retracement. From here, breaching the 38.2% Fib expansionat 1269.10 on a daily closing basis exposes the 1257.69-60.80 area (October 6 low, 50% expansion). Alternatively, a push above 1297.74 sees the next upside hurdle in the 1306.04-9.15 region (October 16 high, 50% retracement).

Chart created using TradingView
CRUDE OIL TECHNICAL ANALYSIS – Crude oil prices stalled after bouncing to retest support-turned-resistance at 56.82. A daily close above this barrier opens the door for a challenge of the 57.72-92 area (23.6% Fibonacci expansion, November 8 high). Alternatively, a turn back below the 23.6% Fib retracement at 55.01 exposes the 38.2% threshold at 53.21.
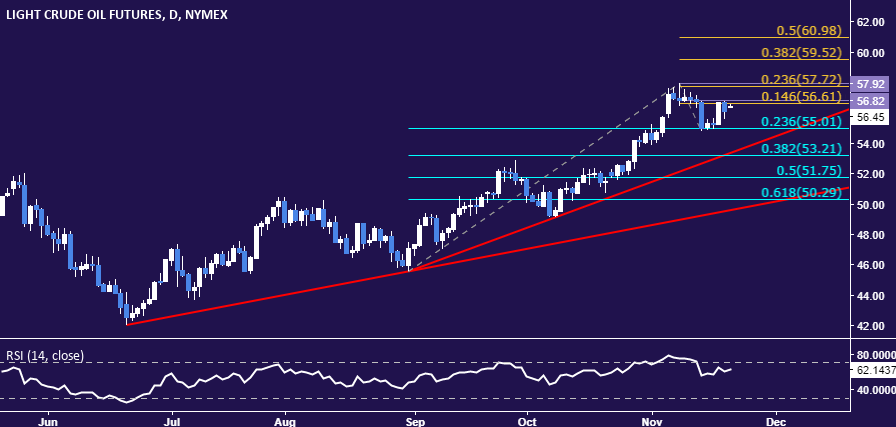
Chart created using TradingView
--- Written by Ilya Spivak, Currency Strategist for DailyFX.com
To receive Ilya's analysis directly via email, please SIGN UP HERE
Contact and follow Ilya on Twitter: @IlyaSpivak


