


Talking Points:
- Crude oil prices may break deadlock on monthly OPEC and EIA reports
- Gold prices look toward progress on US tax cut for directional guidance
- How are our Q4 crude oil and gold forecasts holding up? Find out here
Crude oil prices continued to mark time below $58/barrel absent a clear-cut catalyst to establish direction on Friday. The deadlock may be broken as OPEC issues its monthly assessment of compliance with cartel-led production cuts while the EIA publishes US drilling productivity statistics. Taken together, the two reports ought to inform on global glut reduction prospects.
Gold prices edged down a bit but failed to break from a choppy range prevailing for the better part of the past month. A lull in pertinent top-tier data flow might see speculation about the fate of US tax reform and its implications for Fed policy in the spotlight. A breakthrough in efforts to reconcile Senate and House proposals might send the yellow metal lower while continued deadlock could offer a degree of support.
Retail traders expect gold to rise. Find out here what this hints about actual price trends!
GOLD TECHNICAL ANALYSIS – Gold prices are testing the lower bound of a would-be bearish Triangle chart pattern once again. A daily close below this threshold – now at – would then expose the 1260.80-61.50 area (October 6 low, 50% Fibonacci expansion). Alternatively, a move above Triangle resistance at 1295.43 paves the way for a challenge of the October 16 high at 1306.04.
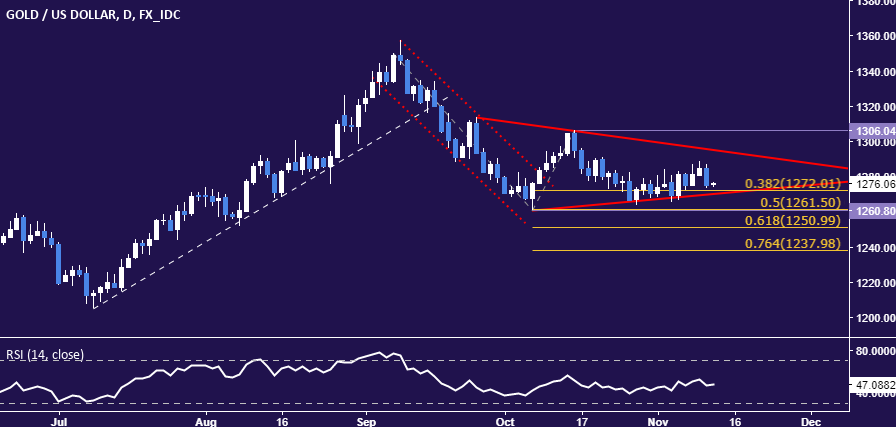
Chart created using TradingView
CRUDE OIL TECHNICAL ANALYSIS – Crude oil prices continue to tread water near resistance marked by the 38.2% Fibonacci expansion at 57.57. A break above this barrier confirmed on a daily closing basis exposes the 50% level at 58.71. Alternatively, a turn back below the 23.6% Fib at 56.17 opens the door for a retest of the January 3 highat 55.24.
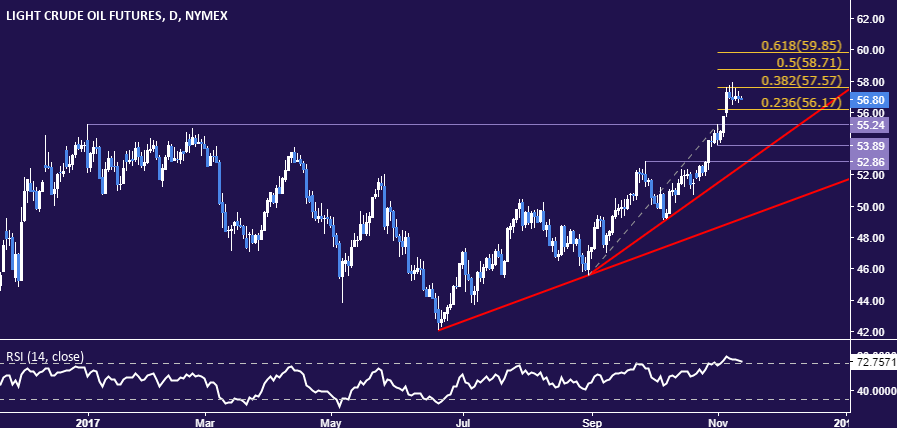
Chart created using TradingView
--- Written by Ilya Spivak, Currency Strategist for DailyFX.com
To receive Ilya's analysis directly via email, please SIGN UP HERE
Contact and follow Ilya on Twitter: @IlyaSpivak


