


Talking Points:
- Gold prices may continue to fall as US Q3 GDP data boosts Fed rate hike bets
- Crude oil prices likely to look to broad-based sentiment trends for direction cues
- What will drive commodities prices through year-end? Get our forecasts here
Gold prices fell as prospects for inflationary tax cuts that push the Federal Reserve into a steeper tightening cycle appeared to brighten. That sent the US Dollar higher alongside front-end Treasury bond yields, sapping demand for non-interest-bearing and anti-fiat assets.
Third-quarter US GDP data is next on tap. The annualized growth rate is expected to slow from 3.1 to 2.6 percent. US economic news-flow has markedly firmed relative to forecasts since mid-June, opening the door for an upside surprise that stokes tightening bets further and compounds pressure on the yellow metal.
Crude oil prices edged up alongside shares, bond yields and the greenback. This seems to imply that the perceived increase in the chance of getting US tax reform on the books before year-end was read as positive for economic growth, with the cycle-sensitive WTI benchmark benefiting in the process.
A tepid offering of oil-specific event risk through the end of the week features Baker Hughes rig count data as well as ICE and CFTC speculative positioning statistics. Those are rarely market-moving, hinting that broader sentiment trends will probably remain in the drivers’ seat.
What is the #1 mistake that traders make and how can you avoid it? Find out here !
GOLD TECHNICAL ANALYSIS – Gold prices broke support at 1269.10, the 38.2% Fibonacci expansion, exposing the 50% level at 1257.69. A further push below that targets the 61.8% barrier at 1246.28. Alternatively, a move back above 1269.10 sees the next upside barrier marked by a falling trend line at 1278.84, followed by the October 20 high at 1291.06.
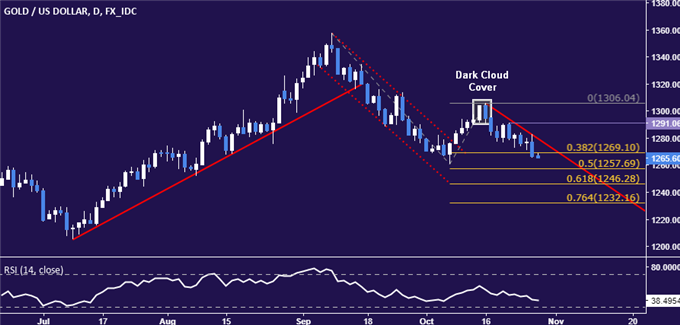
Chart created using TradingView
CRUDE OIL TECHNICAL ANALYSIS – Crude oil prices are pushing up against resistance in the 52.86-53.23 area (September 28 high, 38.2% Fibonacci expansion), with a daily close above that exposing the 50% level at 54.51. Alternatively, a reversal below rising trend line support at 50.96 opens the door for a challenge of the October 6 low at 51.05.
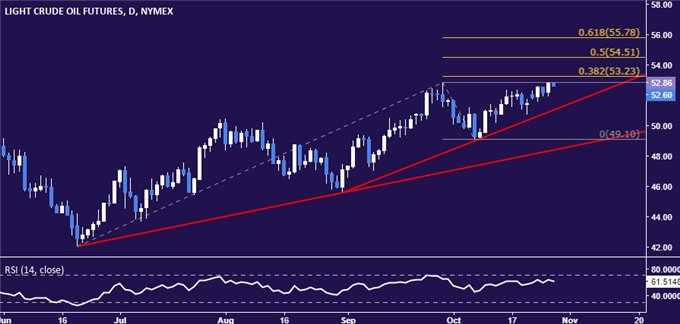
Chart created using TradingView
--- Written by Ilya Spivak, Currency Strategist for DailyFX.com
To receive Ilya's analysis directly via email, please SIGN UP HERE
Contact and follow Ilya on Twitter: @IlyaSpivak


