


Talking Points:
- Gold prices back on the defensive as Fed rate hike bets build anew
- Crude oil prices rise as Iraqi, Kurdish forces disrupt Kirkuk output
- API inventory flow statistics headline otherwise bare data docket
Gold prices turned lower as Fed rate hike expectations began to swell anew after a pause last week. The priced-in probability of another increase before the calendar turns to 2018 rose to 80.2 percent, the highest in nearly two years. The US Dollar dutifully rose alongside front-end Treasury bond yields, undermining the appeal of non-interest-bearing and anti-fiat assets exemplified by the yellow metal.
A clear-cut catalyst is not obvious from here, at least in the near term. The economic calendar is relatively tame, the Fed-speak schedule is uneventful and US stock index futures are trading flat ahead of the opening bell on Wall Street, pointing to neutral sentiment trends. A similarly bare offering hasn’t stopped markets from retracing last week’s moves in the past 24 hours however, so more of the same may be in store.
Crude oil prices rose as government forces clashed with Kurdish fighters in Iraq’s oil-rich Kirkuk province, shuttering two fields. Meanwhile, the EIA Drilling Productivity Report delivered a downgrade of October’s shale oil output forecast, from 6.08 to 6.04 million barrels per day. API weekly inventory flow data is now in focus. For context, the analogous set of official EIA data is seen showing a 3.84 million barrel draw.
What are the fundamental forces shaping crude oil price trends? Find out here !
GOLD TECHNICAL ANALYSIS – Gold prices put in a bearish Dark Cloud Cover candlestick pattern, hinting a move lower may be ahead. Near-term support is at 1291.92, the 14.6% Fibonacci expansion, with a daily close below that targeting the 23.6% level at 1283.22. Alternatively, break above the October 16 high at 1306.04 sees the next upside barrier at 1320.56, the 61.8% Fib retracement.
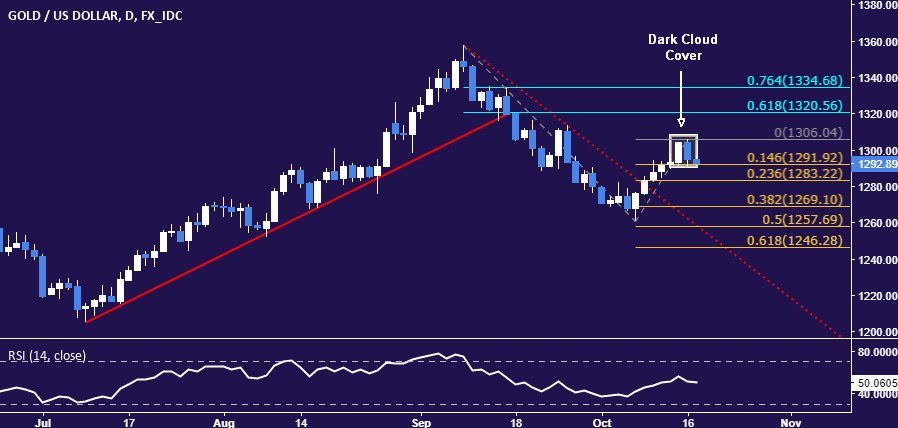
Chart created using TradingView
CRUDE OIL TECHNICAL ANALYSIS – Crude oil prices look poised to challenge resistance in the 52.83-53.22 area (September 28 high, 38.2% Fibonacci expansion). A daily close above that exposes the 50% level at 54.49. Alternatively, a reversal back below the 23.6% Fib at 51.65 targets the 14.6% expansion at 50.68.
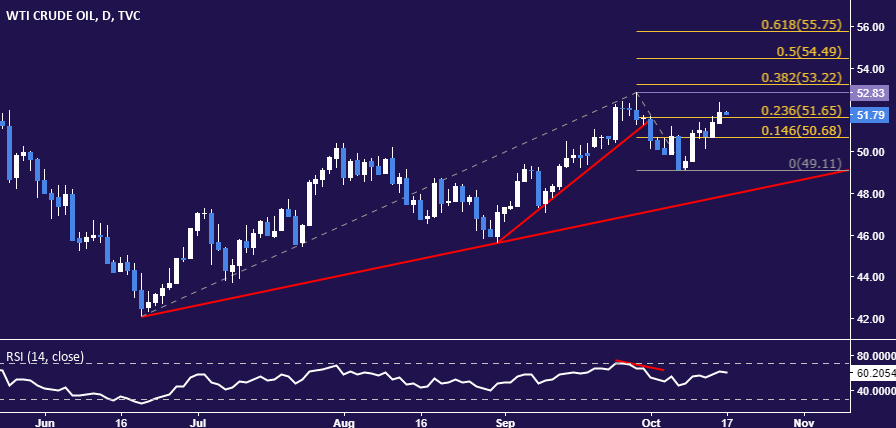
Chart created using TradingView
--- Written by Ilya Spivak, Currency Strategist for DailyFX.com
To receive Ilya's analysis directly via email, please SIGN UP HERE
Contact and follow Ilya on Twitter: @IlyaSpivak


