


Talking Points:
- Crude oil prices rise as Saudi Arabia pledges “unprecedented” output cut
- Gold prices extend recovery as markets digest build in Fed rate hike bets
- OPEC and EIA reports, API inventory data and FOMC minutes up ahead
Crude oil prices rose after Saudi Arabia said state-owned giant Aramco will cut output by an “unprecedented” cut of 560k barrels per day next month. Comments from OPEC Secretary-General Mohammad Barkindo signaling the cartel-led production cut accord may be extended and perhaps even broadened to other participants probably helped as well.
From here, monthly reports from OPEC and the EIA will update investors’ outlook on supply/demand dynamics while API inventory flow statistics will offer a glimpse into the pace of recovery of US infrastructure following hurricane-related disruptions. By way of context, official numbers due Thursday are expected to show stockpiles shed 2.04 million barrels last week.
Gold prices rose for a third consecutive day as the markets continued to take advantage of a lull in top-tier US economic news flow to digest three weeks of swelling Fed rate hike expectations. The spotlight now turns to minutes from September’s FOMC meeting. A hawkish tone matching recent pronouncements from central bank officials may boost the US Dollar, putting the yellow metal back on the defensive.
What do retail traders’ buy/sell decisions hint about crude oil and gold price trends? Find out here !
GOLD TECHNICAL ANALYSIS – Gold prices are testing support-turned-resistance at 1290.75, a barrier reinforced by the 23.6% Fibonacci expansion at 1296.79. A daily close above the latter level exposes the 38.2% Fib at 1319.05. Alternatively, a move back below a recently broken trend line at 1272.73 paves the way for another challenge of the October 6 low at 1260.80.
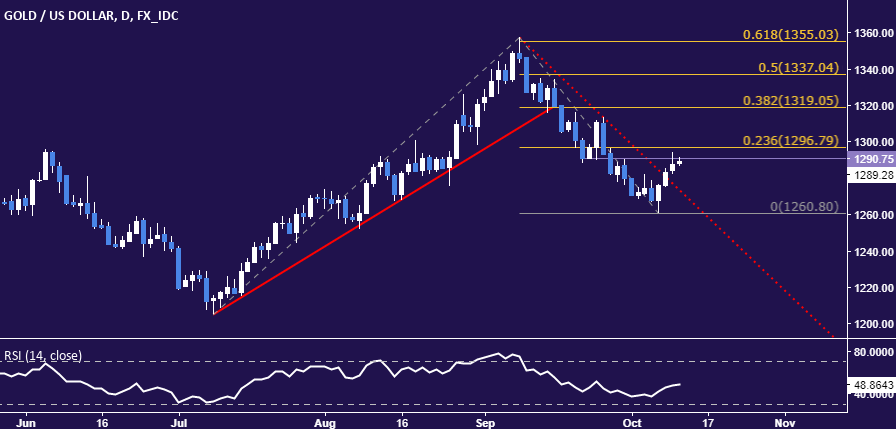
Chart created using TradingView
CRUDE OIL TECHNICAL ANALYSIS – Crude oil prices launched a spirited recovery after finding support above the $49/bbl figure. A daily close above the 23.6% Fibonacci expansion at 51.65 opens the door for a test of the 52.83-53.22 area (September 28 high, 38.2% level). Alternatively, a turn back below the 14.6% Fib at 50.68 opens the door for a retest of the October 9 low at 49.11.
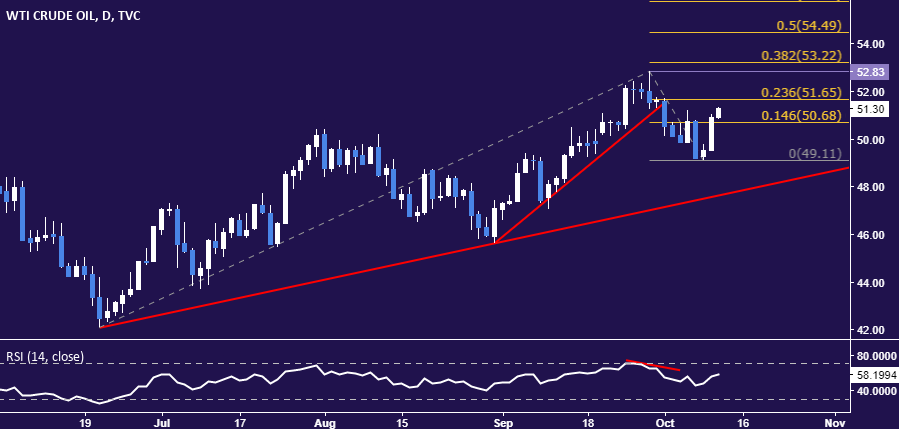
Chart created using TradingView
--- Written by Ilya Spivak, Currency Strategist for DailyFX.com
To receive Ilya's analysis directly via email, please SIGN UP HERE
Contact and follow Ilya on Twitter: @IlyaSpivak


