


Talking Points:
- Gold prices resume upward march as Fed rate hike prospects unwind
- Topping chart formation negated but negative RSI divergence ominous
- Crude oil prices stall as twitchy markets eye hurricanes Irma and Jose
Gold prices pushed higher as deteriorating Fed rate hike prospects sank the US Dollar, boosting the appeal of the benchmark anti-fiat asset. The greenback fell to a 15-month low against an average of its top counterparts as the priced-in probability of a third increase in 2017 slipped to 22.6 percent, the lowest yet this year.
Crude oil prices stalled, with upside momentum seemingly undone as markets pondered the potential impact of Hurricane Irma and yet another storm – dubbed “Jose” – now gathering steam over the Atlantic. The WTI contract bounced ahead of EIA inventory flow data but that disappointed, leaving it rudderless.
Looking ahead, a lull in top tier news flow leaves commodities without an obvious catalyst. S&P 500 futures are pointing cautiously lower, hinting gold may continue to build higher as risk aversion weighs on bond yields. Meanwhile, energy prices may be too consumed with weather reports to notice much else.
What is the #1 mistake that traders make, and how can you fix it? Find out here !
GOLD TECHNICAL ANALYSIS – Gold prices overturned a Bearish Engulfing candlestick pattern noted yesterday, punching through resistance marked by the 38.2% Fibonacci expansion at 1344.04. From here, a daily close above the 50% level at 1358.32 targets the 61.8% Fib at 1372.59. Negative RSI divergence warns of ebbing upside momentum, hinting a turn lower may yet materialize. A move back below 1344.04 – now recast as support – exposes the 23.6% expansion at 1326.38.

Chart created using TradingView
CRUDE OIL TECHNICAL ANALYSIS – Crude oil prices sit within a hair of key resistance at 49.73, a barrier marked by a falling trend line capping gains since February and the 50% Fibonacci expansion. A daily close above that exposes the 61.8% level at 50.71. Alternatively, a reversal back belowthe 38.2% Fib at 48.75 opens the door for a retest of the 23.6% expansion at 47.53.
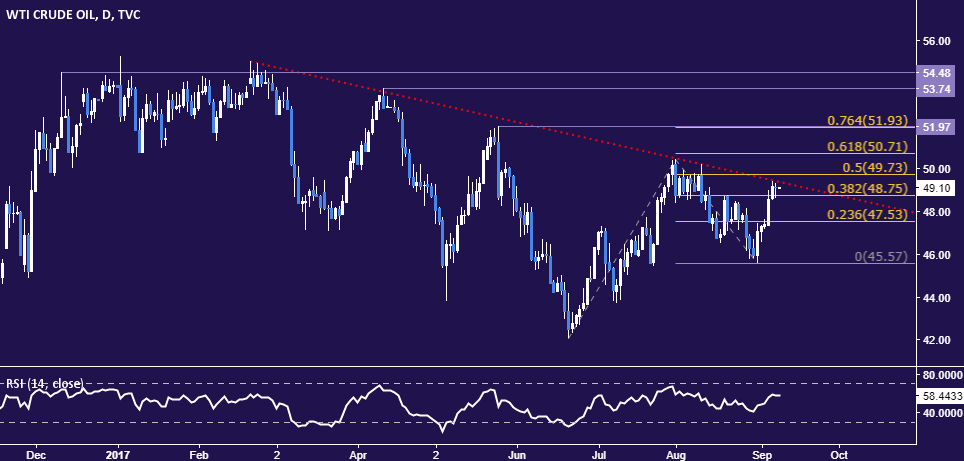
Chart created using TradingView
--- Written by Ilya Spivak, Currency Strategist for DailyFX.com
To receive Ilya's analysis directly via email, please SIGN UP HERE
Contact and follow Ilya on Twitter: @IlyaSpivak


