


Talking Points:
- Crude oil prices rise for fifth day, challenge 7-month trend resistance
- Gold prices decline following services ISM, Fed Beige Book surveys
- ECB rate decision, EIA crude oil inventory data now in the spotlight
Crude oil prices continued to push upward, scoring the fifth consecutive day of gains. Support from rebuilding refining capacity in the wake of Hurricane Harvey was helped along by comments from Russian Energy Minister Alexander Novakand weekly inventory flow statistics from API.
Novak said an OPEC-led production cut scheme may be extended if the market hasn’t balanced by April 2018. Meanwhile, API said stockpiles added 2.79 million barrels last week, a smaller increase than the 3.67 million build expected to appear in official EIA statistics due today.
As noted previously however, gains may not be lasting. EIA data set probably needs to show an even-smaller storage inflow than the API result to offer prices a lasting boost. Meanwhile, Libya has restarted the Shahara oil field – its largest – and US energy infrastructure is at risk again, this time from Hurricane Irma.
Gold prices turned lower as the US Dollar and benchmark Treasury bond yields rebounded in tandem, undermining the appeal of non-interest-bearing and anti-fiat assets. The move followed ISM data showing service-sector activity growth accelerated and a relatively sanguine Fed Beige Book survey.
The spotlight now turns to a policy announcement from the European Central Bank. The yellow metal may fall further if Mario Draghi and company signal that a winding down – or “tapering” – of its QE asset purchase effort is around the corner. The absence of such guidance may yield the opposite result.
What is the #1 mistake that traders make, and how can you fix it? Find out here !
GOLD TECHNICAL ANALYSIS – Gold prices put in a Bearish Engulfing candlestick pattern, hinting a turn lower may be ahead. A move below resistance-turned-support at 1326.38 – the 23.6% Fibonacci expansion – sees the next downside barrier marked by the 14.6% level at 1315.49. Alternatively, a push above the 38.2% Fib at 1344.04 exposes the 50% expansion at 1358.32.

Chart created using TradingView
CRUDE OIL TECHNICAL ANALYSIS – Crude oil prices are poised to test trend line resistance that has capped the upside for seven months, a barrier reinforced by the 50% Fibonacci expansion at 49.73. A daily close above this barrier would initially expose the 61.8% level at 50.71. Alternatively, a move back below the 38.2% Fib at 48.75 targets the 23.6% expansion at 47.53 anew.
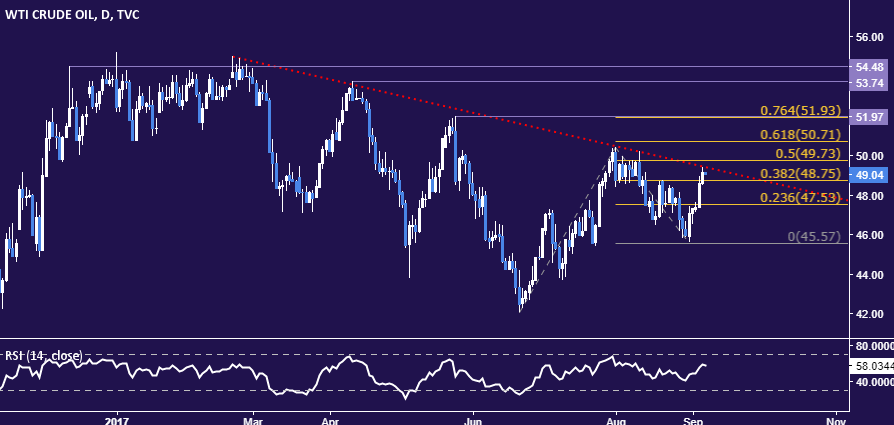
Chart created using TradingView
--- Written by Ilya Spivak, Currency Strategist for DailyFX.com
To receive Ilya's analysis directly via email, please SIGN UP HERE
Contact and follow Ilya on Twitter: @IlyaSpivak


