Talking Points:
- Crude oil prices rebound to challenge short-term down trend
- Gold prices rise as US PCE inflation gauge hits 17-month low
- Upbeat US jobs report may send commodities broadly lower
Crude oil prices rebounded after three consecutive days of losses. The move may have followed from the announcement that Harvey has been downgraded to from a tropical storm to a “depression”, hinting that US refining capacity – which has been brought to a seven-year low – may start to be rebuilt relatively soon.
Pipeline and refinery closures courtesy of the storm disrupted the flow of raw material to producers of gasoline, distillates and other processed products. This dealt a heavy blow to the process of working down a supply glut that has weighed on the WTI benchmark for much of the year.
An EIA report showing US crude output fell 0.8 percent in June may have also offered support. Production registered at 9.1 million barrels per day, down from 9.17 million in May and lower than the 9.32 million estimate implied by an average of weekly statistics.
Gold prices rose as the Fed’s favored PCE core inflation gauge ticked down to 1.4 percent in July, the lowest level since December 2015. While the outcome matched consensus forecasts, it seemed to undermine rate hike prospects nonetheless, sending the US Dollar lower alongside Treasury bond yields.
Looking ahead, US employment data is firmly in focus. July’s PCE data may start to appear dated if wage inflation ticks higher as expected. If that and the headline payrolls print outperform forecasts, echoing the rosy trend in overall US news-flow since mid-June, Fed tightening bets may recover.
Such a scenario bodes ill for gold, undermining as it would the appeal of non-interest-bearing and anti-fiat assets. It may also apply de-facto pressure to crude oil alongside the spectrum of USD-denominated assets as the greenback trades higher.
What is the #1 mistake that traders make, and how can you fix it? Find out here !
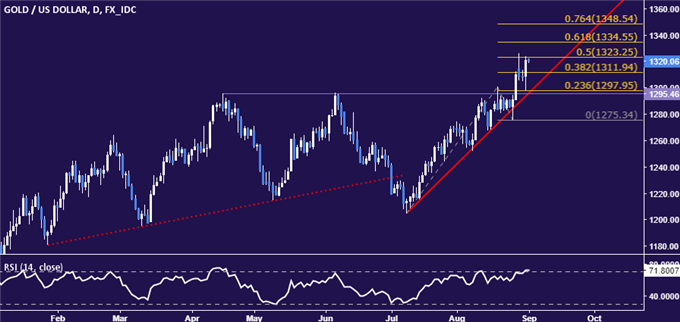
GOLD TECHNICAL ANALYSIS – Gold prices regained upward momentum, pushing through resistance marked by the 38.2% Fibonacci expansion at 1311.94. From here, a daily close above the 50% level at 1323.25 exposes the 61.8% Fib at 1334.55. Alternatively a reversal back below 1311.94 – now recast as support – opens the door for a retest of the 1295.46-97.95 area (double top, 23.6% expansion).

Chart created using TradingView
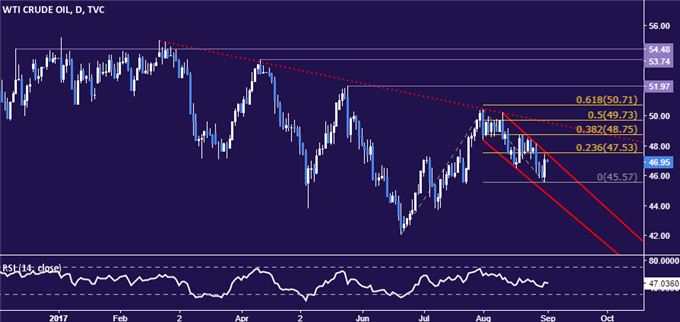
CRUDE OIL TECHNICAL ANALYSIS – Crude oil prices bounced to challenge the bounds of its near-term down trend, a threshold reinforced by the 23.6% Fibonacci expansion at 47.53. A daily close above this barrier targets the 38.2% level at 48.75. The August 31 low at 45.57 marks near-term support, followed by a falling wedge floor at 44.73.

Chart created using TradingView
--- Written by Ilya Spivak, Currency Strategist for DailyFX.com
To receive Ilya's analysis directly via email, please SIGN UP HERE
Contact and follow Ilya on Twitter: @IlyaSpivak


