


Talking Points:
- Gold prices may fall on US PMI, Yellen speech sought for follow-through
- Crude oil prices eyeing Chinese energy trade figures amid demand worries
- Have a commodities trading question? Join a Q&A webinar and ask it live
Gold prices edged lower as a recovery in risk appetite pushed Treasury bond yields higher alongside stock prices. The US Dollar also rose in tandem as improving sentiment echoed in a supportive shift in Fed rate hike expectations. Not surprisingly, this undermined the appeal of non-interest-bearing and anti-fiat assets epitomized by the yellow metal.
August’s US PMI survey roundup is in focus on the data front, with the pace of manufacturing- and service-sector activity growth expected to accelerate. US economic news-flow has increasingly improved relative to forecasts over the past two months, opening the door for outperformance. While that may hurt gold, follow-through will likely have to wait for Fed Chair Yellen’s speech on Friday.
Crude oil prices stalled absent a meaningful catalysts. API said US inventories shed 3.6 million barrels last week. That is within a hair of the 3.3 million barrel drawdown expected to be reported in official EIA statistics today and so was probably read as status-quo. Chinese energy trade statistics are also due to cross the wires. More signs of slowing demand from the world’s top oil consumer may unnerve markets.
What are the fundamental forces driving crude oil prices? Find out here !
GOLD TECHNICAL ANALYSIS – Gold prices remain locked in a range below resistance in the 1295.46-1300.46 area (double top, 38.2% Fibonacci expansion). Negative RSI divergence continues to warn of ebbing upside momentum, which may precede a downturn. Breaking below 1278.22 (23.6% Fib retracement, trend line) on a daily closing basis targets the 38.2% level at 1264.23 next. Alternatively, a breach of resistance exposes the 50% expansion at 1310.74.
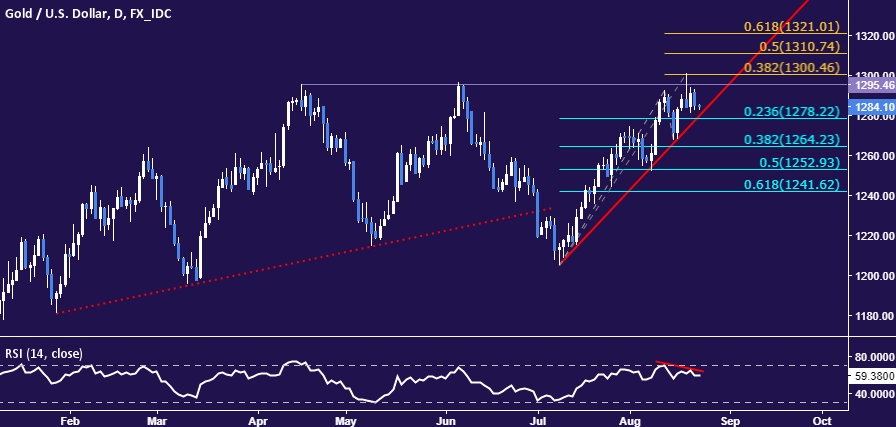
Chart created using TradingView
CRUDE OIL TECHNICAL ANALYSIS – Crude oil prices are stalling having found support above the $46/barrel figure. From here, a daily close below the 38.2% Fibonacci expansion at 46.62 opens the door for a test of the 50% level at 45.46. Alternatively, a push above support-turned-resistance at 48.76 (range floor, trend line) paves the way for retest of the August 1 high at 50.40.

Chart created using TradingView
--- Written by Ilya Spivak, Currency Strategist for DailyFX.com
To receive Ilya's analysis directly via email, please SIGN UP HERE.
Contact and follow Ilya on Twitter: @IlyaSpivak


