


Talking Points:
- Crude oil prices bounce from 3-week low on API inventory data
- Weekly EIA report, CNPC Chinese demand outlook now in focus
- Gold prices may fall further on upbeat FOMC meeting minutes
Crude oil prices posted a modest rebound having slipped to a three-week low after API said US inventories shed 9.2 million barrels last week, a far larger drop than the 3 million barrel draw expected to be reported in official EIA figures today. If they come closer to API projections, a further bounce may be in the cards.
China National Petroleum Corp is also scheduled to release its outlook for local and global energy demand at 6 GMT. A steep drop in refining activity weighed on prices amid worries of ebbing uptake from the world’s largest crude consumer. More evidence on the same might prove likewise negative.
A drop in gold prices amid easing geopolitical instability fears was compounded as upbeat US retail sales figures bolstered Fed interest rate hike prospects, as expected. That drove the US Dollar higher alongside Treasury bond yields, undermining support for non-interest-bearing and anti-fiat assets.
Minutes from July’s FOMC meeting are now in focus. Rhetoric suggesting policy makers remain confident in their standing projection – last updated in June – calling for three interest rate hikes in 2017 (of which two are already in the history books) may punish the yellow metal further.
Retail traders expect gold to rise. Find out here what that hints about the actual price trend!
GOLD TECHNICAL ANALYSIS – Gold prices declined as expected after producing a bearish Evening Star candlestick pattern. From here, a daily close below the 23.6% Fibonacci expansion at 1270.58 exposes rising trend line support at 1264.66, followed by the 38.2% level at 1257.29. Alternatively, a reversal back above the 14.6% Fib at 1278.78 opens the door for a retest of double top resistance at 1295.46.

Chart created using TradingView
CRUDE OIL TECHNICAL ANALYSIS – Crude oil prices paused to digest losses but conspicuously failed to break back above rising trend line support set from June’s swing low, bolstering the case for a bearish reversal in progress. A daily close below the 23.6% Fibonacci expansion at 47.30 exposes the 38.2% level at 45.38. Alternatively, an advance back above the trend line – now at 47.94 – targets the 14.6% Fib at 48.48.
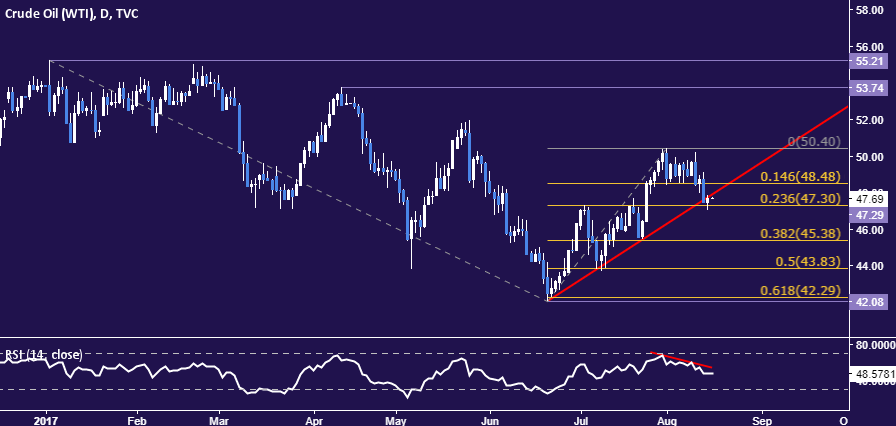
Chart created using TradingView
--- Written by Ilya Spivak, Currency Strategist for DailyFX.com
To receive Ilya's analysis directly via email, please SIGN UP HERE
Contact and follow Ilya on Twitter: @IlyaSpivak


