


Talking Points:
- Gold prices gain after Trump threatens North Korea, sinking bond yields
- Crude oil prices still range-bound, looking to EIA data for direction cues
- What will drive longer-term oil and gold trends? See our forecasts here
Gold prices are finding renewed support after fiery comments from US President Donald Trump raised the specter of war with North Korea. Capital fled to the safety of government bonds, sinking yields and boosting the relative appeal of non-interest-bearing assets including the yellow metal.
Looking ahead, a lackluster offering of scheduled US event risk hints that Fed policy speculation will take a back seat to risk trends once again. FTSE 100 and S&P 500 futures are pointing decidedly lower, arguing for continued risk aversion that might keep gold marching upward.
Crude oil prices shrugged off API data showing US inventories shed 7.84 million barrels last week. That drop is well in excess of the 2.37 million drawdown expected to be revealed when the official EIA set of analogous statistics prints on Wednesday.
The WTI benchmark drifted lower, which might reflect disappointment in the absence of a deal on larger output cuts at a meeting of OPEC-led producers. The formal announcement of such an accord might have been delayed until the group’s meeting on August 21 however, which may explain sluggish selling.
The previously mentioned EIA report takes center stage from here. An inventory outflow closer to API’s hefty estimate may register as supportive but follow-through will depend on whether output growth outpaces the reduction in stockpiles.
Have a question about trading crude oil and gold? Join a Q&A webinar and ask it live!
GOLD TECHNICAL ANALYSIS – Gold prices are attempting to reclaim a foothold abovechart inflection point resistance at 1260.85. A break higher confirmed on a daily closing basis opens the door for a retest of the August 1 high at 1274.11. Alternatively, a reversal below the 23.6% Fibonacci expansion at 1252.62 exposes the 38.2% level at 1239.33.
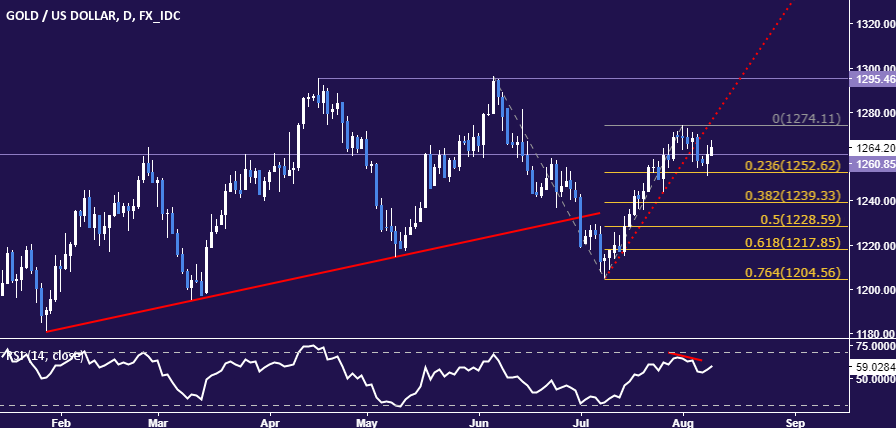
Chart created using TradingView
CRUDE OIL TECHNICAL ANALYSIS – Crude oil prices continue to oscillate in a familiar range below the 61.8% Fibonacci retracementat 50.19. Initial support comes at 48.65, the 50% level, with daily close below that exposing the 47.10-29 area (38.2% Fib, July 4 high, trend line). Alternatively, a push above 50.19 sees the next upside barrier marked by the 76.4% level at 52.11.
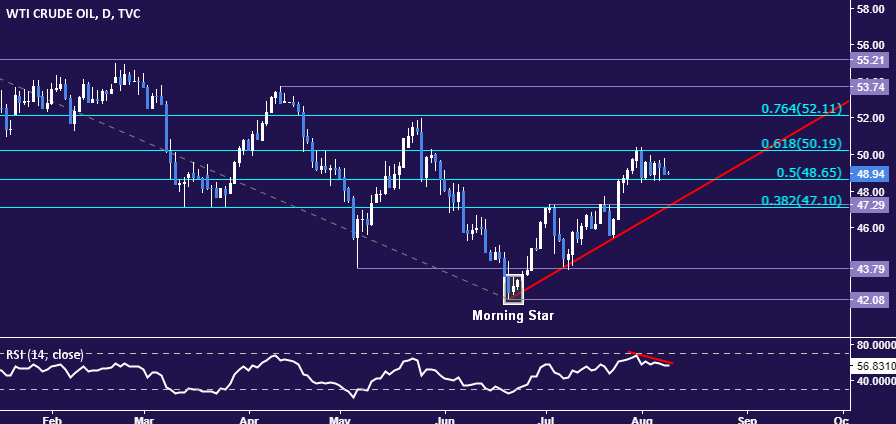
Chart created using TradingView
--- Written by Ilya Spivak, Currency Strategist for DailyFX.com
To receive Ilya's analysis directly via email, please SIGN UP HERE.
Contact and follow Ilya on Twitter: @IlyaSpivak


