Talking Points:
- Crude oil prices down as star trader Andy Hall closes flagship fund
- Gold prices may decline as US jobs data revives Fed rate hike bets
- Are commodities matching DailyFX bets so far in Q3? Find out here
Crude oil prices retreated back to the floor of their weekly range as famed oil investor Andy Hall closed his flagship commodities fund after suffering a loss of nearly 30 percent in the first half of the year. The news appeared to dent investors’ confidence. Still, it did not have enough heft to push the WTI benchmark out of familiar territory absent meaningful fundamental developments, as expected.
Gold prices erased intraday losses as US Treasury bond yields declined and the priced-in rate hike outlook implied in Fed Funds futures flattened, boosting the relative appeal of non-interest-bearing assets. The move began long before the day’s US data flow began to cross the wires, hinting that it might’ve reflected pre-positioning ahead of the upcoming release of July’s employment report.
Consensus forecasts point to a slowdown in payrolls growth and wage inflation. An outcome echoing recent improvement in US data outcomes relative to baseline expectations may boost the US Dollar, undermining the appeal of anti-fiat alternatives and sending the yellow metal lower. A lasting reversal will probably need a pickup in wage inflation however.
Need help translating commodity market news into a strategy? Check out our trading guide !
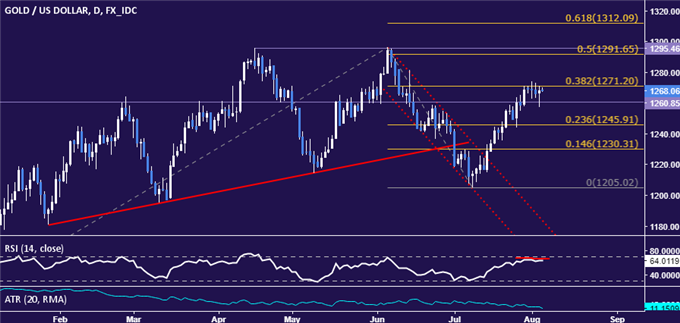
GOLD TECHNICAL ANALYSIS – Gold prices continue to mark time below resistance at 1271.20, the 38.2% Fibonacci expansion. Negative RSI divergence warns that a reversal may be in the cards. A reversal below inflection point support at 1260.85 targets the 23.6% level at 1245.91. Alternatively, a push above resistance confirmed on a daily closing basis exposes the 1291.65-95.46 area (50% Fib, double top).

Chart created using TradingView
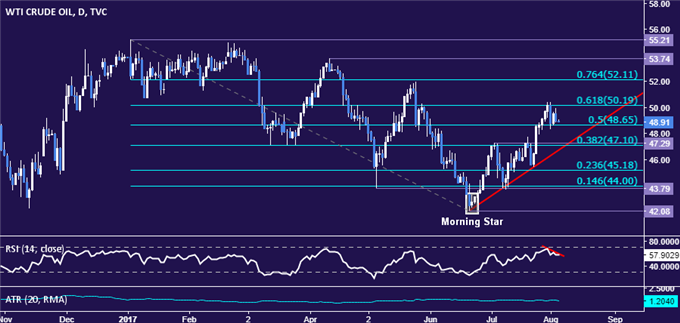
CRUDE OIL TECHNICAL ANALYSIS – Crude oil prices are in digestion mode below resistance at 50.19, the 61.8% Fibonacci retracement, with negative RSI divergence hinting that a move lower may be ahead. A daily close below the 50% level at 48.65 exposes the 47.10-29 area (38.2% Fib, July 4 high). Alternatively, a push above 50.19 targets the 76.4% retracement at 52.11.

Chart created using TradingView
--- Written by Ilya Spivak, Currency Strategist for DailyFX.com
To receive Ilya's analysis directly via email, please SIGN UP HERE
Contact and follow Ilya on Twitter: @IlyaSpivak


