


Talking Points:
- Crude oil prices look to EIA data for direction following sharp drop
- Gold prices may decline on ADP jobs data, Fed officials’ comments
- Are commodities matching DailyFX bets so far in Q3? Find out here
Crude oil prices sank output from Libya – an OPEC member exempt from coordinated output cuts – helped drive the cartel’s exports to a 2017 high. Cargo-tracking firm Kpler said the group shipped 26.7 million barrels in July. API data helped amplify the selloff, showing US inventories added 1.78 million barrels last week.
From here, the spotlight turns to the official weekly EIA inventorydata set. That is expected to reveal a drawdown of nearly 3.5 million barrels. An outcome closer to the figures foreshadowed by API may compound downside pressure.
Gold prices struggled to for new direction cues after a mixed set of US economic data outcomes failed to give a decisive lead to Fed policy speculation. PCE inflation registered higher than expected but the ISM measure of factory-sector activity growth underwhelmed.
The ADP estimate of private-sector US jobs growth as well as speeches from San Francisco and Cleveland Fed Presidents John Williams and Loretta Mester are now in focus. In aggregate, these may offer a lift to the US Dollar, undermining the appeal of anti-fiat assets including the yellow metal.
Need help translating commodity market news into a strategy? Check out our trading guide !
GOLD TECHNICAL ANALYSIS – Gold prices continue to mark time below resistance at 1271.20, the 38.2% Fibonacci expansion. A break above that confirmed on a daily closing basis targets the 1291.65-95.46 area (50% level, double top). Alternatively, a turn back below chart inflection point support at 1260.85 exposes the 23.6% Fib at 1245.91.
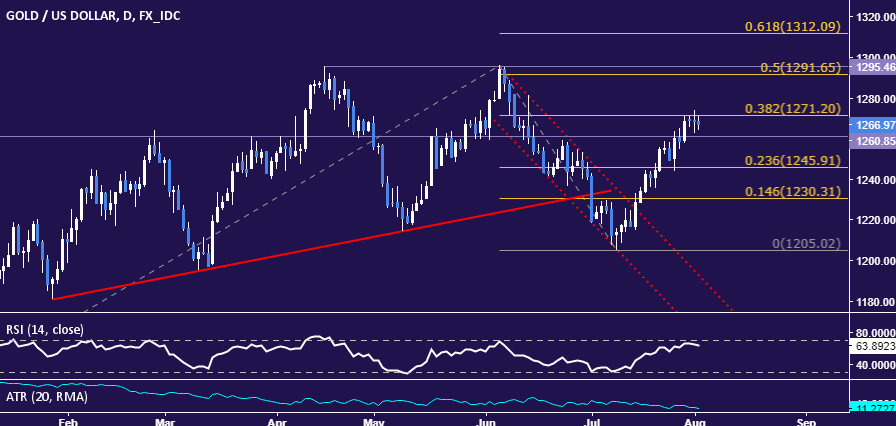
Chart created using TradingView
CRUDE OIL TECHNICAL ANALYSIS – Crude oil prices recoiled from resistance at 50.19, the 61.8% Fibonacci retracement. From here, a daily close below the 50% level at 48.65 opens the door for a test of the 47.10-29 area (38.2% Fib, July 4 high). Alternatively, a push above 50.19 exposes the 76.4% retracement at 52.11.
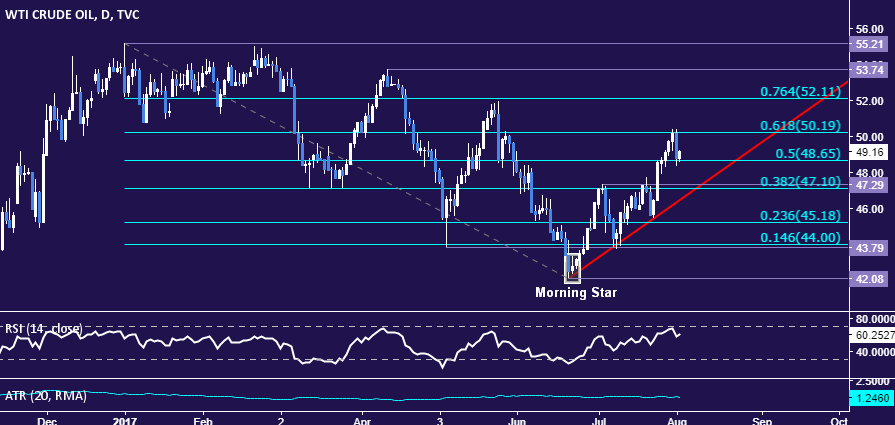
Chart created using TradingView
--- Written by Ilya Spivak, Currency Strategist for DailyFX.com
To receive Ilya's analysis directly via email, please SIGN UP HERE
Contact and follow Ilya on Twitter: @IlyaSpivak


