


Talking Points:
- Gold prices may retreat if US PCE, ISM data revive 2017 Fed rate hike bets
- Crude oil prices surge before US sanctions Venezuela, API data now in focus
- What will drive longer-term commodity price trends? See our forecasts here
Gold prices have paused to digest gains after rising to the highest level in seven weeks. A round of high-profile US economic data releases may break the standstill. July’s ISM manufacturing survey and June’s PCE gauge of inflation – the Fed’s favorite – are due to cross the wires.
Upbeat outcomes echoing recently improved news-flow may boost bets on another rate hike in 2017, sending the US Dollar and Treasury bond yields higher in tandem. That would undermine the appeal of anti-fiat and non-interest-bearing assets, punishing the yellow metal.
Crude oil prices rose for a sixth consecutive day. Prices set a daily low around 17:00 GMT and bounced sharply higher thereafter, seemingly without a singularly identifiable catalyst. The move might have reflected speculation that the US will sanction Venezuela following what it called a “sham” election.
About two hours later, US officials announced sanctions personally targeting Venezuelan President Nicolas Maduro. Curiously, crude’s rally set an intraday top shortly after the announcement. This might imply that markets entertained bets on a broader action that ultimately did not materialize (at least for now).
From here, the spotlight turns to API weekly inventory flow data. The result will be sized up against forecasts for official EIA figures to be released on Wednesday, which are expected to show an outflow of 3.61 million barrels. A smaller draw may weigh on prices while a larger one might produce another upward push.
Need help translating commodity market news into a strategy? Check out our trading guide !
GOLD TECHNICAL ANALYSIS – Gold prices are stalling below resistance at 1271.20, the 38.2% Fibonacci expansion. A daily close above this barrier expose the 1291.65-95.46 area (50% level, double top). Alternatively, a move back below the chart inflection point at 1260.85 clears the way for a retest of the 23.6% Fib at 1245.91.
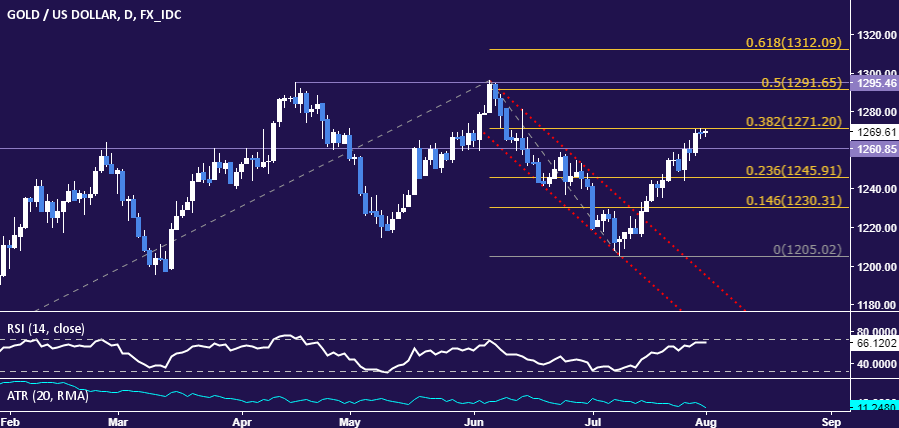
Chart created using TradingView
CRUDE OIL TECHNICAL ANALYSIS – Crude oil prices broke above resistance defining the down trend since February, challenging the 61.8% Fibonacci retracement at 50.19. A daily close above that opens the door for a test of the 76.4% level at 52.11. Alternatively, a move back below the trend line – now recast as support at 49.78 – paves the way for a retest of the 50% Fib at 48.65.

Chart created using TradingView
--- Written by Ilya Spivak, Currency Strategist for DailyFX.com
To receive Ilya's analysis directly via email, please SIGN UP HERE
Contact and follow Ilya on Twitter: @IlyaSpivak


