


Talking Points:
- Crude oil prices to weigh EIA inventory flow figures against US output trends
- Gold prices may extend drop if defiant FOMC rekindles rate hike speculation
- What will drive longer-term crude oil and gold price trends? See our forecasts
Crude oil prices shot higher as the United Arab Emirates stressed its commitment to OPEC-led coordinated production cut effort and pledged to reduce shipments by a further 10 percent starting in September. The comments echoed similar remarks from Saudi Arabia yesterday. Prices got a further boost from API data showing US inventories shed a hefty 10.2 million barrels last week.
The official set of EIA inventory flow statistics is now on tap, with an outflow of 3.13 million barrels is expected. An outcome closer to the API print may offer prices a further boost but the figures will compete for influence with another Department of Energy release: a monthly report on supply trends. If this points to swelling US output, the move higher may struggle.
Gold prices slumped as front-end US Treasury bond yields moved higher, undermining the appeal of non-interest-bearing assets. The move probably reflects pre-positioning ahead of the upcoming Fed monetary policy announcement. Rhetoric at par with the FOMC-defined status quo might sound hawkish relative to traders’outlook,pushing them rethink their position and sending the yellow metal lower still.
Want to discuss crude oil and gold price moves with a DailyFX analyst? Join a live webinar !
GOLD TECHNICAL ANALYSIS – Gold prices turned lower, producing a bearish Evening Star candlestick pattern. The setup hints a turn downward may be in the works. From here, a daily close below the 14.6% Fibonacci expansion at 1245.50 exposes the 23.6% level at 1237.30. Alternatively, a push above the 61.8%Fib retracementat 1261.16 targets the 76.4% level at 1274.57 next.

Chart created using TradingView
CRUDE OIL TECHNICAL ANALYSIS – Crude oil prices pushed through resistance in the 47.10-29 area (38.2% Fibonacci retracement, July 4 high) to challenge the 50% level at 48.65. A daily close above this barrier exposes 50.19 (trend line, 61.8% Fib). Alternatively, a turn back below 47.10 opens the door for a retest of support at 45.32.
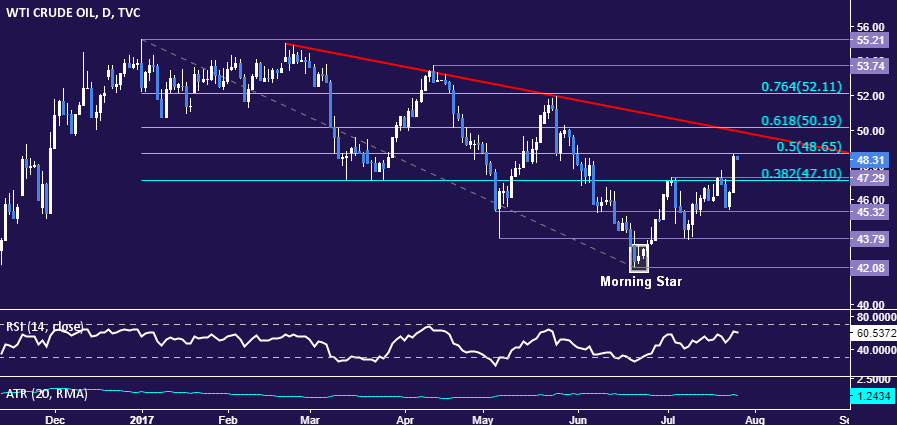
Chart created using TradingView
--- Written by Ilya Spivak, Currency Strategist for DailyFX.com
To receive Ilya's analysis directly via email, please SIGN UP HERE
Contact and follow Ilya on Twitter: @IlyaSpivak


