


Talking Points:
- Crude oil prices bounce even as IEA worries out loud about market glut
- Gold prices may rise as soft US CPI continues to cool Fed rate hike bets
- Where will gold and crude oil go in the third quarter? See our forecasts
Crude oil prices turned higher even as the IEA warned that global market rebalancing has become less certain. The agency cited increasing OPEC output despite a cartel-led production cut effort even as more swing supply – particularly from the US – comes online. This has derailed efforts to drain bloated stockpiles.
Seemingly counter-intuitive price action may reflect corrective flows triggered by the passage of the last bit of major event risk for the week. The Baker Hughes rig count report is on tap but this rarely generates a significant response. Indeed, the WTI benchmark’s average move in the 30 minutes after the weekly release is a mere 0.03 percent.
The knock-on impact of US Dollar volatility may emerge as a catalyst into the week-end as June’s CPI data is released. The report is expected to show that year-on-year inflation slowed to 1.7 percent, marking the fourth consecutive month of deceleration and the weakest reading since November 2016. A soft print may cool Fed rate hike bets, pushing the currency lower.
A significant inverse correlation between the greenback and the WTI contract has been rebuilt in recent weeks and now stands at -0.78 on rolling 20-day studies, the highest since March 2016. This hints that a weaker US currency may echo as higher oil prices. The response from gold prices is likely to be far more directly positive in this scenario as a dovish policy view boosts the appeal of anti-fiat assets.
Need help turning commodities news into an actionable strategy? Check out our trading guide !
GOLD TECHNICAL ANALYSIS – Gold prices faltered ahead of channel resistance guiding the down move since early June. Near-term support is at 1212.48, the 14.6% Fibonacci expansion, with a break below that on a daily closing basis targeting the 23.6% level at 1204.28. Alternatively, a push above the channel top and the 23.6%Fib retracementat 1226.26 exposes the 38.2% threshold at 1239.60.
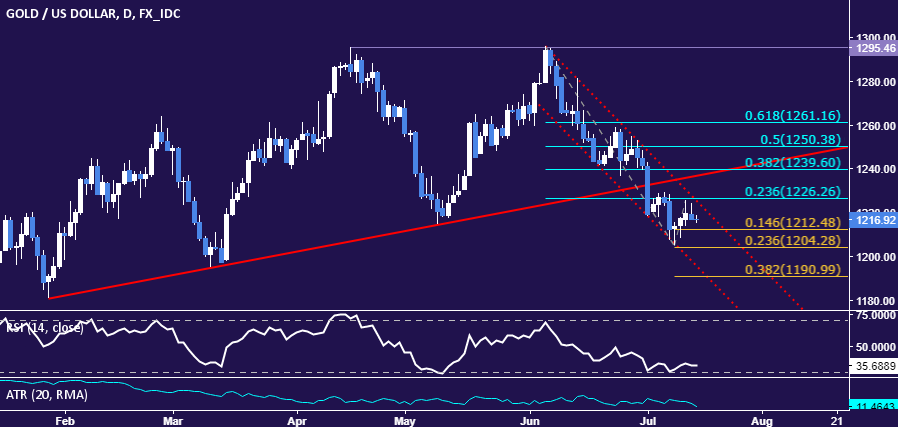
Chart created using TradingView
CRUDE OIL TECHNICAL ANALYSIS – Crude oil prices are attempting to rebuild upside momentum after holding up on a retest of support at 45.32. From here, a daily close above the 38.2% Fibonacci retracement at 47.10 exposes the 50% level at 48.65. Alternatively, a turn below 45.32 sees the next layer of support at 43.79, the May 5 low.
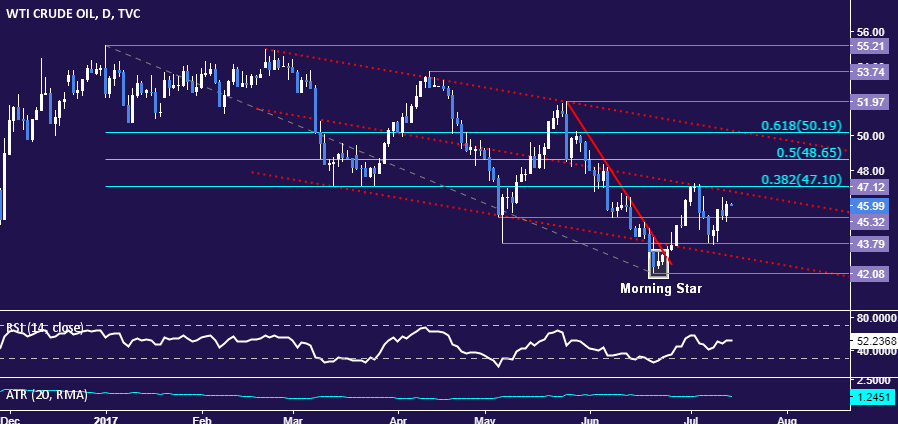
Chart created using TradingView
--- Written by Ilya Spivak, Currency Strategist for DailyFX.com
To receive Ilya's analysis directly via email, please SIGN UP HERE
Contact and follow Ilya on Twitter: @IlyaSpivak


