


Talking Points:
- Gold prices swoon to 6-week low in apparent ‘fat finger’ error
- Crude oil prices continue to retrace after hitting 10-month low
- Yellen leads Fed-speak docket, API inventory flow data on tap
Gold prices suddenly dropped to a six week low in a move without obvious catalysts. Newswires cited traders attributing the drop on a so-called “fat finger” mistake, alluding to human error in executing a large position. Others blamed the move on trading algorithms, which have become favored scapegoats for otherwise inexplicable price moves in recent years.
The spotlight turns to a busy offering of Fed commentary in the day ahead. FRB Chair Janet Yellen headlines a docket that also includes San Francisco, Philadelphia and Minneapolis branch presidents Williams, Harker and Kashkari (respectively). Traders will look for officials to address the gap between the FOMC 2017 rate hike forecast and that of the markets.
The rate-setting committee expects to raise the target Fed Funds rate by a further 25bps this year. Investors are dubious, with futures markets pricing in no further changes at least until the calendar turns to 2018. Softening inflation and a string of US economic data disappointments since mid-March seem to support the latter view. The Fed has acknowledged recently soft conditions but argues that they are temporary.
Smooth policy implementation will require Fed officials to sway markets to their side of the argument. The generalities on offer after the FOMC’s June sit-down and in subsequent commentary haven’t delivered on that score. Yellen and company will need to dial up the sales pitch if they are to be successful, which may translate into more forceful rhetoric and send gold lower. A repeat of familiar tropes may pass mostly unnoticed.
Crude oil prices continued to correct higher after hitting a ten-month low last week. The spotlight now turns to weekly API inventory flow data. The outcome will be sized up against official EIA figures due to cross the wires on the following day. Those are expected to show that raw-material stockpiles shed 1.9 million barrels while gasoline reserves are drawn down by 100k barrels.
What do other traders’ buy/sell decisions hint about gold price trends? Find out here !
GOLD TECHNICAL ANALYSIS – Gold prices retreated back to chart inflection point support at 1241.20. A daily close below this barrier opens the door for a test of rising trend line support at 1230.92. Near-term resistance is at 1260.85, a pivot level that has variously acted as support and resistance since late February.
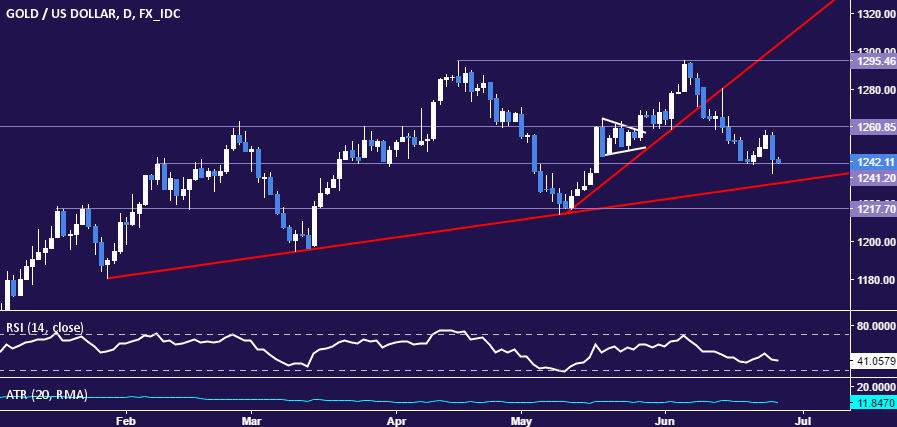
Chart created using TradingView
CRUDE OIL TECHNICAL ANALYSIS – Crude oil prices are edging higher after putting in a bullish Morning Star candlestick pattern, taking out a falling trend line guiding the down move from late-May highs. A daily close above 43.79 (May 5 low, channel floor support-turned-resistance) opens the door for a retest of 45.32 (May 4 bottom). Alternatively, a move back below the trend line – now at 42.54 – exposes the June 21 low at 42.03.
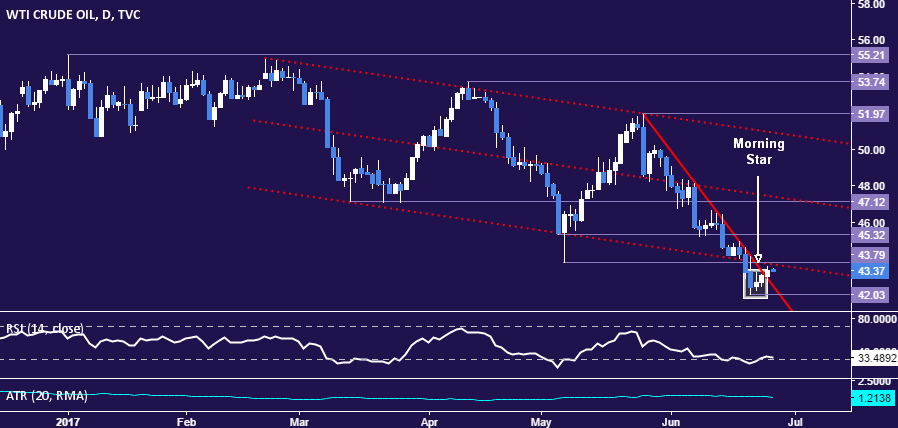
Chart created using TradingView
--- Written by Ilya Spivak, Currency Strategist for DailyFX.com
To receive Ilya's analysis directly via email, please SIGN UP HERE
Contact and follow Ilya on Twitter: @IlyaSpivak


