


Talking Points:
- Crude oil prices bounce after sinking to a 10-month low
- Gold prices gain as Treasury yields, US Dollar retreat
- EIA Energy Conference, US durable goods data ahead
Crude oil prices are edging higher after hitting a ten-month low late last week. The recovery followed weekly DOE inventory data showing raw-material stockpiles fell more than expected while and gasoline stocks were unexpectedly drawn down in the week to June 16. News of increased compliance with the OPEC-led production cut scheme and an API report pointing to rising US gasoline demand probably helped as well.
From here, the spotlight turns to the EIA Energy Conference getting underway in Washington DC. The gathering of industry bigwigs may produce scheduled and sideline commentary that offers insight supply trends as traders weigh up the tug of war between OPEC and swing producers (notably in the US). Confidence in near-term supply glut reduction may help prices continue to recover.
Gold prices have launched a recovery of their own as front-end US Treasury bond yields pulled back alongside the US Dollar, boosting the appeal of non-interest-bearing and anti-fiat assets. US durable goods orders numbers for the month of May are now in focus. Forecasts point to drop of 0.6 percent. If actual results echo recent US data disappointments, ebbing Fed rate hike bets may help extend the move higher.
Need help with your commodities trading strategy? Check out our trading guide.
GOLD TECHNICAL ANALYSIS – Gold prices are in digestion mode after posting three consecutive days of gains. From here, a daily close above the 23.6% Fibonacci expansion at 1259.98 opens the door for a test of the 38.2% level at 1271.90. Alternatively, a move back below the 14.6% Fib at 1252.63 targets a chart inflection point at 1241.20.
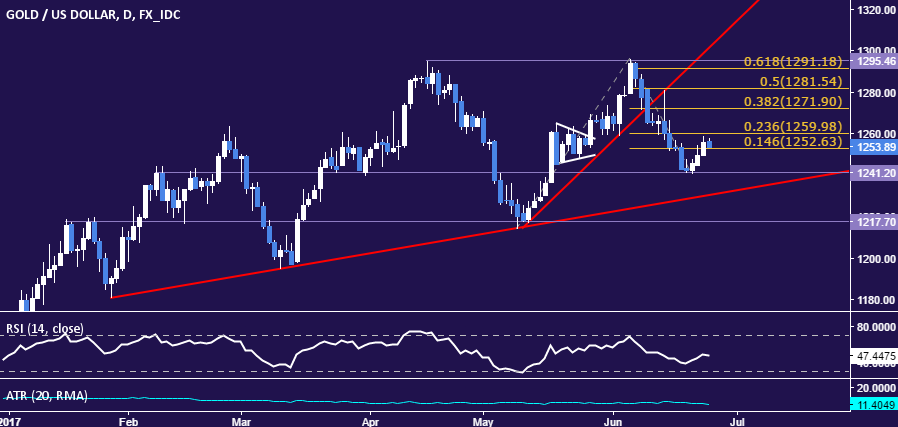
Chart created using TradingView
CRUDE OIL TECHNICAL ANALYSIS – Crude oil prices are attempting to overturn the down trend in play since late May. A daily close above 43.20 (23.6% Fibonacci expansion, trend line) opens the door for a test of 43.79 (May 5 low, channel floor). Alternatively, a push below the 38.2% level at 42.07 targets the 50% Fib at 41.16.

Chart created using TradingView
--- Written by Ilya Spivak, Currency Strategist for DailyFX.com
To receive Ilya's analysis directly via email, please SIGN UP HERE
Contact and follow Ilya on Twitter: @IlyaSpivak


