Talking Points:
- Crude oil prices may resume down move on API inventory data
- Gold prices fall after hawkish comments from NY Fed’s Dudley
- More Fed-speak may compound pressure on precious metals
Crude oil prices have stalled absent fresh fodder to drive trend development after sinking to a six-week low. Weekly API inventory flow figures may break the deadlock when they cross the wires later today. A smaller draw than the 1.13 million barrel outflow expected to be reported in analogous, official EIA data on Wednesday may revive selling pressure.
Gold prices fell as the US Dollar rose alongside front-end Treasury bond yields, sapping demand for non-interest-bearing and anti-fiat assets. The move followed comments from New York Fed President Bill Dudley, who is often seen as of a bellwether on the rate-setting FOMC committee. He expressed confidence in the durability of the US economic expansion, triggering a hawkish shift in policy expectations.
Looking ahead, another busy day on the Fed-speak front may continue to weigh on prices if policymakers’ tone mirrors the confident posture on display in last week’s policy announcement. Comments from Vice Chair Stanley Fischer as well as Boston and Dallas Fed branch presidents Eric Rosengren and Robert Kaplan (respectively) are on the docket.
What do retail traders’ buy/sell decisions hit about gold price trends? Find out here !
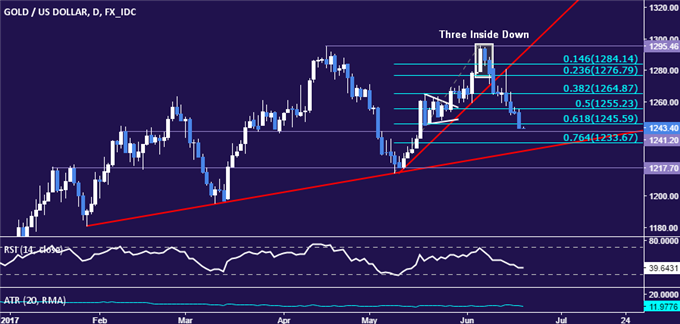
GOLD TECHNICAL ANALYSIS – A fourth consecutive day of losses brought gold prices to test support in the 1241.20-45.59 area (inflection point, 61.8% Fibonacci retracement). A daily close below targets the 76.4% level at 1233.67, followed by a rising trend line at 1228.62. Alternatively, a return above the 50% Fib at 1255.23 sees the next upside barrier at 1264.87, the 38.2% retracement.

Chart created using TradingView
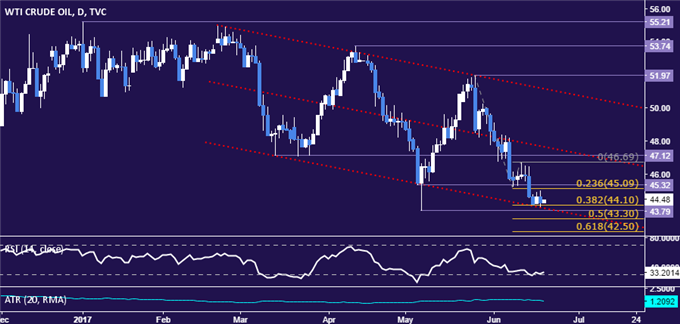
CRUDE OIL TECHNICAL ANALYSIS – Crude oil prices are in digestion mode at key support in the 43.79-44.10 area (channel floor, May 5 low, 38.2% Fibonacci expansion). A daily close below that opens the door for a challenge of the 50% level at 43.30. Alternatively, a turn back above the 45.09-32 zone (23.6% Fib, May 4 low) exposes the 46.69-47.12 region (June 12 high, chart inflection point) anew.

Chart created using TradingView
--- Written by Ilya Spivak, Currency Strategist for DailyFX.com
To receive Ilya's analysis directly via email, please SIGN UP HERE
Contact and follow Ilya on Twitter: @IlyaSpivak


