


Talking Points:
- Gold prices drop before FOMC monetary policy announcement
- Risk aversion may weigh on bond yields, offering gold a lifeline
- Crude oil prices may resume selloff as data shows supply swell
Gold prices fell for a third consecutive day as US Treasury bond yields rose, undermining the appeal of non-interest-bearing assets. The move may have reflected pre-positioning ahead of this week’s FOMC monetary policy announcement, which is widely expected to produce a rate hike. Indeed, the priced-in 2017 rate hike path implied in Fed Funds futures now stands at the steepest in a month.
A relatively quiet economic calendar may see risk appetite trends take the forefront in the near term. FTSE 100 and S&P 500 futures are pointing lower, hinting that European and US shares will follow weakness seen on Asian bourses at the start the week. That may see haven-seeking capital bid up bonds and send yields lower, offering a lifeline to the yellow metal.
Crude oil prices marked time absent fresh catalysts. The standstill may be broken as the EIA releases its drilling productivity report. This is foreshadowed by Baker Hughes data showing that the number of active US extraction rigs stood at the highest in 26 months as of last week. Further signs of swelling output may bolster the view that OPEC supply cut efforts will be overwhelmed, sending prices lower.
Have a question about trading crude oil and gold? Join a Q&A webinar and ask it live!
GOLD TECHNICAL ANALYSIS – Gold prices turned lower after producing a bearish Three Inside Down candlestick pattern, with a break of near-term trend line support hinting a double top is now in place. Near-term support is now at 1260.85, with a break below that exposing another chart inflection point at 1241.20. Alternatively, a reversal above trend line support-turned-resistance, now at 1275.50, opens the door for a retest of the double top at 1295.46.

Chart created using TradingView
CRUDE OIL TECHNICAL ANALYSIS – Crude oil prices have stalled to digest losses after dropping to the lowest level in a month. From here, a daily close below support at 45.32 exposes 43.79, a level marked by the May 5 low and reinforced by the bottom of a falling channel in play since late February. Alternatively, a move back above the chart inflection point at 47.12 targets the channel midline at 47.90.
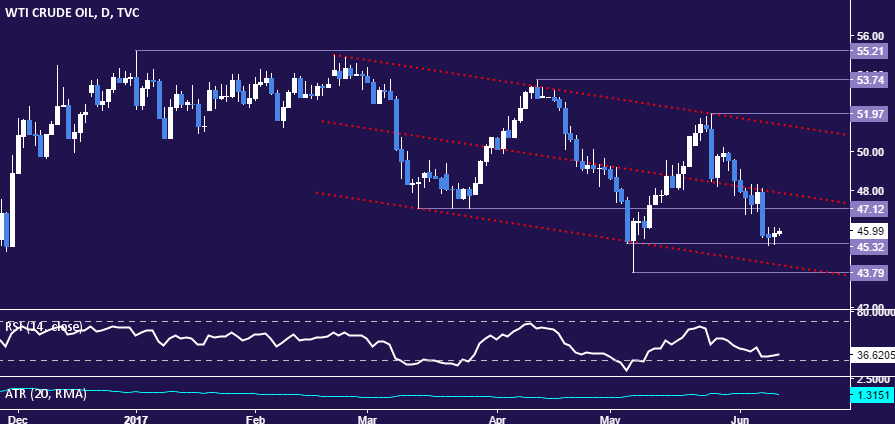
Chart created using TradingView
--- Written by Ilya Spivak, Currency Strategist for DailyFX.com
To receive Ilya's analysis directly via email, please SIGN UP HERE
Contact and follow Ilya on Twitter: @IlyaSpivak


