


Talking Points:
- Gold prices rise as bond yields drop amid risk aversion
- Crude oil prices testing familiar support at $47/bbl level
- API inventory data, DOE energy outlook on tap ahead
Gold prices are building on gains scored following Friday’s release of May’s deeply disappointing US jobs statistics. That outcome weighed on Treasury bond yields and the US Dollar, boosting the appeal of non-interest-bearing assets.
Now, a backdrop of risk aversion is depressing rates as haven-seeking capital flows are pouring into government debt, offering the yellow metal another boost. S&P 500 futures are pointing lower to hint that more of the same may be in the cards ahead.
Crude oil prices succumbed to broader risk-off dynamics overnight, tracking losses in share prices. The WTI benchmark has been falling for five consecutive days however. The move seems to mark continuation of the drop following the underwhelming extension of an OPEC-led output cut scheme.
The spotlight now turns to API inventory flow data, which will set the tone for official EIA figures on tap for the following day. That release is expected to show stockpiles shed 3.3 million barrels last week. The DOE is also due to publish its short-term energy outlook.
Retail traders are betting on gold price gains. Find out here what that hints about the price trend!
GOLD TECHNICAL ANALYSIS – Gold prices look poised to challenge the $1300/oz figure after an expected mode higher breached resistance at a falling trend line capping gains for 11 months. A daily close above the 50% Fibonacci expansion at 1300.73 exposes the 61.8% level at 1321.10. Alternatively, a move back below the 1275.08-80.35 zone (38.2% Fib, trend line) opens the door for a retest of the 1256.74-63.87 congestion area.
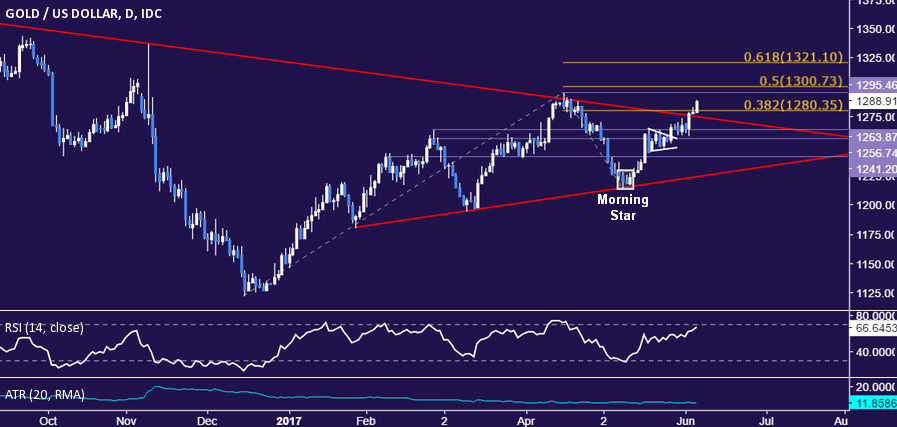
Chart created using TradingView
CRUDE OIL TECHNICAL ANALYSIS – Crude oil prices continue to test support at the $47/bbl figure. A break of this barrier confirmed on a daily closing basis exposes the 61.8% Fibonacci expansionat 45.82. Alternatively, move back above the 38.2% level at 48.17 targets 50.26, the May 29 high.
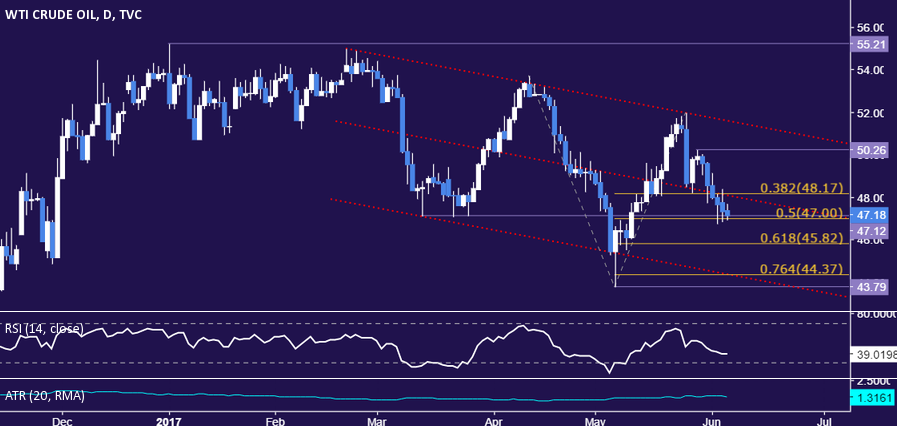
Chart created using TradingView
--- Written by Ilya Spivak, Currency Strategist for DailyFX.com
To receive Ilya's analysis directly via email, please SIGN UP HERE
Contact and follow Ilya on Twitter: @IlyaSpivak


