


Talking Points:
- Gold prices fall as US Dollar, Treasury bond yields recover
- Minutes from May FOMC meeting may see gold fall further
- Crude oil prices extend gains before pivotal OPEC meeting
Gold prices declined as Treasury bond yields rose alongside the US Dollar, undermining the appeal of non-interest-bearing and anti-fiat assets epitomized by the yellow metal. The move came well after the day’s offering of relevant economic data, suggesting it may reflect pre-positioning ahead of the upcoming release of minutes from May’s FOMC policy meeting.
Last week, fear about US political uncertainty flattened the priced-in 2017 rate hike path. However, the Fed was aiming to speed up tightening well before doing so became linked to the Trump administration’s would-be inflationary policies in the minds of investors. A confident tone in the Minutes document may serve as a timely reminder, boosting the greenback and punishing gold further.
Crude oil prices continued to push higher ahead of an OPEC meeting expected to produce a nine-month extension of a cartel-led production cut effort expiring mid-year. A committee of representatives from six producer nations has been charged with weighing up the merits of a 12-month extension but the baseline view continues to favor a program extended through March 2018.
This committee will meet today ahead of a conclave of all OPEC and non-OPEC output cut participants on Thursday and comments from the sidelines of the sit-down may prove market-moving. The official set of EIA inventory flow data is also due to cross the wires. Forecasts point to a 2.08 million barrel draw but an API estimate hinted a smaller outflow of 1.5 million barrels yesterday.
How are our Q2 gold and crude oil forecasts holding up with a month left to go? Find out here !
GOLD TECHNICAL ANALYSIS – Gold prices continue to mark time below resistance in the 1256.74-63.87 area, which has acted as both support and resistance over the past three months. A daily close above this barrier exposes a falling trend line capping gains for nearly 11 months, now at 1278.65. Alternatively, a turn back below the 23.6% Fibonacci expansion at 1235.91 targets rising trend support at 1219.71.
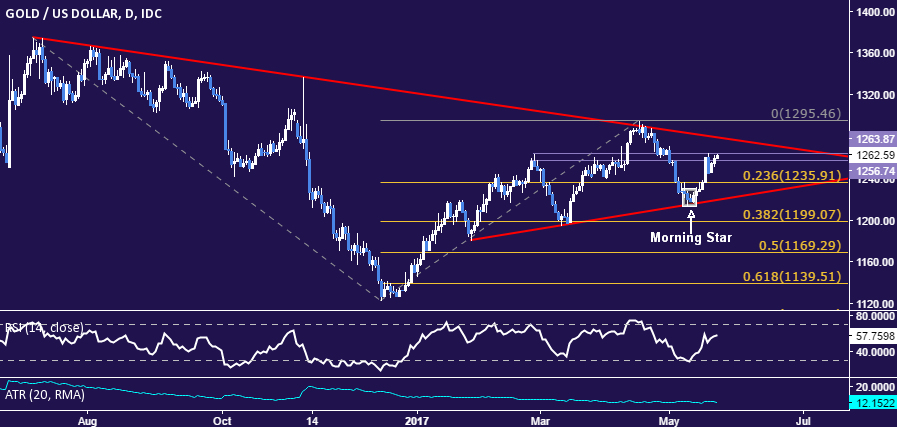
Chart created using TradingView
CRUDE OIL TECHNICAL ANALYSIS – Crude oil prices rose for a fifth consecutive day, with buyers now eyeing resistance at 52.51 marked by the 76.4%Fibonacci retracement. A daily close above that opens the door for a challenge of trend line resistance at 53.14. Alternatively, a reversal below the 61.8%level at 50.85 paves the way for a retest of the 50% Fib at 49.50.

Chart created using TradingView
--- Written by Ilya Spivak, Currency Strategist for DailyFX.com
To receive Ilya's analysis directly via email, please SIGN UP HERE
Contact and follow Ilya on Twitter: @IlyaSpivak


