


Talking Points:
- Crude oil prices extend losing streak for seventh consecutive day
- Gold prices continue to decline as bond yields rise in risk-on trade
- API inventory data, US home sales and consumer confidence due
Crude oil prices continued to decline, dropping to the lowest level in a month. A standout catalyst explaining intraday losses was not readily apparent but the broader narrative making the rounds on the newswires pointed to concerns about the inability of OPEC output cuts to boost prices in the face of swelling swing supply.
Sellers’ resolve will be tested as API inventory flow data crosses the wires in the hours ahead. Official EIA figures due the following day are expected to show a 1.6 million barrel drawdown. An API number that falls short of that may produce another down day whereas a larger outflow may offer prices a lifeline.
Gold prices remained on the defensive having dropped after the first-round vote in the French presidential election. European shares have picked up on a positive lead from Asia, pushing bond yields higher and pressuring the yellow metalfurther. S&P 500 futures hint at more of the same as Wall Street comes online.
The move lower may be capped if US economic data pours cold water on rate hike bets however. New home sales and consumer confidence report are on tap, with weakening expected on both fronts. US data outcomes have deteriorated relative to forecasts in recent weeks, warning of elevated downside surprise risk.
Retail traders are net buyers of gold. Find out here what this hints about on-coming price moves!
GOLD TECHNICAL ANALYSIS – A close below trend line support the move higher since mid-March suggests long-term downtrend resumption may be at hand after gold prices topped below the $1300/oz figure, as expected. From here, a daily close below the 14.6% Fibonacci expansion at 1258.62 exposes the 1235.91-41.50 area (October 7 2016 low, 23.6% level). Alternatively, a push above falling trend line resistance at 1287.46 opens the door for a test of the 1295.46-1308.00 region (April 17 high, support-turned-resistance).

Chart created using TradingView
CRUDE OIL TECHNICAL ANALYSIS – A seventh consecutive daily drop has given crude oil prices their worst losing streak in over a year. From here, a daily close below the 48.56-85 area (trend line, 61.8% Fibonacci expansion) paves the way for a test of the 47.08-69 zone (March 22 low, 76.4% level). Alternatively, a reversal above the 50% Fib at 49.78 exposes the 38.2% expansion at 50.71.
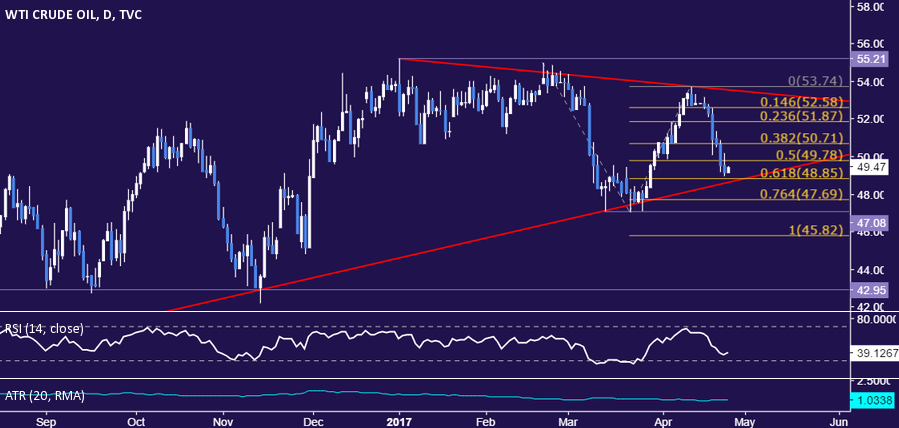
Chart created using TradingView
--- Written by Ilya Spivak, Currency Strategist for DailyFX.com
To receive Ilya's analysis directly via email, please SIGN UP HERE
Contact and follow Ilya on Twitter: @IlyaSpivak


