


Talking Points:
- Crude oil, gold prices surge after US missile strike on Syria
- Upbeat US employment data may boost Fed rate speculation
- Commodities vulnerable if Trump, Xi find common ground
Crude oil prices surged to a one-month high after an unexpected US airstrike against Syria stoked worries about regional supply disruption. The move built on yesterday’s gains that saw the WTI benchmark marching higher alongside the S&P 500, hinting a generally risk-on mood offered support for the cycle-sensitive commodity.
Looking ahead, the on-going meeting between US and Chinese Presidents Donald Trump and Xi Jinping remains a potent catalyst. As noted previously, signs of emerging common ground may be interpreted to mean US crude oil will flow interrupted to its biggest export market, capping price gains.
Gold prices surged as news of the Syria strike crossed the wires but the metal has been conspicuously unable to hold above critical chart resistance (see below). The March set of US employment figures is now in focus. A payrolls gain of 180k is expected, marking the smallest increase in three months.
US data flow has tended to outperform relative to forecasts in recent months, hinting that analysts are underestimating the economy’s vigor and opening the door for an upside surprise. Such an outcome may stoke Fed rate hike speculation, pressuring gold prices downward.
The Trump/Xi meeting is also an important consideration. A seemingly cordial outing may cool worries about the destabilizing impact of a rift between the world’s top-two economies. That would help clear a path for continued Fed tightening, helping to pull the metal lower.
What will drive commodity prices next week? Join our outlook webinar and find out!
GOLD TECHNICAL ANALYSIS – Gold prices continue to push up against trend-defining resistance in the 1263.87-65.66 area (February swing high, trend line, 50% Fibonacci expansion). A daily close above this barrier initially exposes the 61.8% level at 1282.31. Alternatively, a turn below the 1241.20-49.01 zone (former resistance, 38.2% Fib) targets 1218.90, an inflection point in play since mid-January.
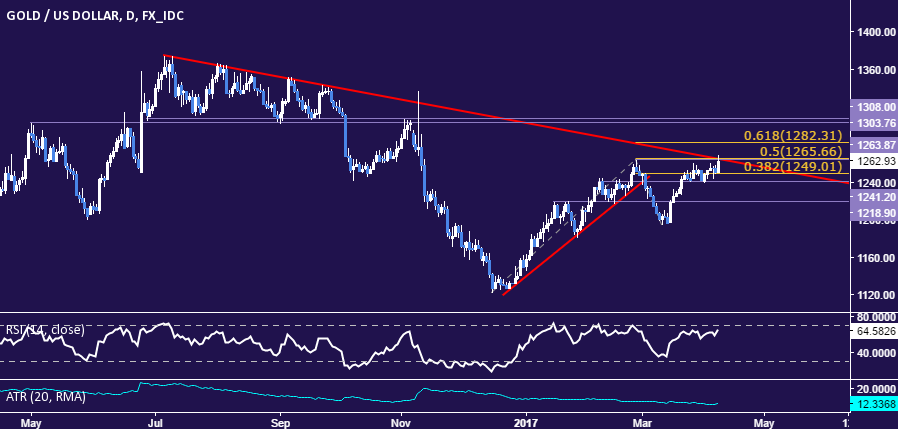
Chart created using TradingView
CRUDE OIL TECHNICAL ANALYSIS – Crude oil prices are testing above resistance at 52.04, the 38.2%Fibonacci expansion, with confirmation of a break on a daily closing basis opening the door for a test of the 50% level at 53.57. Alternatively, a reversal below support at 50.14, the 23.6%Fib, exposes the 14.6% expansion at 48.98.
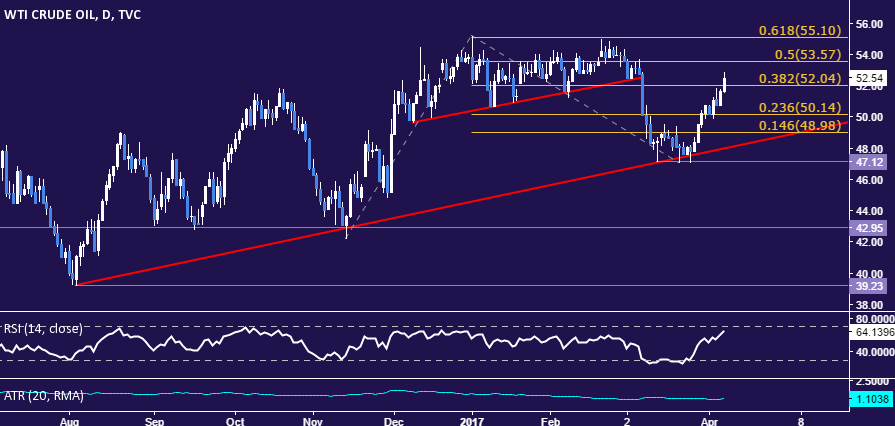
Chart created using TradingView
--- Written by Ilya Spivak, Currency Strategist for DailyFX.com
To receive Ilya's analysis directly via email, please SIGN UP HERE
Contact and follow Ilya on Twitter: @IlyaSpivak


