


Talking Points:
- Gold prices rise as risk aversion sends Treasury yields lower
- Stock futures hint sour sentiment to extend to Wall Street trade
- Crude oil prices drop, US export and inventory figures ahead
Gold prices rose as Treasury bond yields fell amid risk aversion following soft US economic data. The ISM survey of manufacturing-sector activity showed growth slowing, albeit no more than expected. An analogous PMI reading from Markit Economics was revised downward from a rosier flash estimate.
Most European equity markets are following Asian bourses downward and US stock index futures are hinting at more of the same when Wall Street comes online. That may keep tight lid on rates, boosting the relative appeal of non-interest-bearing assets and offering a further lift to the yellow metal.
Crude oil prices sank, snapping a four-day winning streak and suffering the largest loss in a month. News-wires attributed the selloff to reports that output from Libya has surged to 660k barrels per day from close to 500k last week as the Sharara field – the country’s biggest – reopened for operation.
The spotlight now turns to the weekly API inventory flow report. That will be complemented by Census Bureau data on US crude exports through February. Taken together, the figures will help inform supply trend speculation as investors weigh swelling swing output against OPEC production cuts.
Have a question about trading gold and crude oil? Join a Q&A webinar and ask it live!
GOLD TECHNICAL ANALYSIS – Gold prices are edging back toward key resistance at 1263.87, marked by February’s swing high and a falling trend line capping gains since July 2016. A break upward on a daily closing basis would hint that a lasting change of the near-term trajectory is at hand.
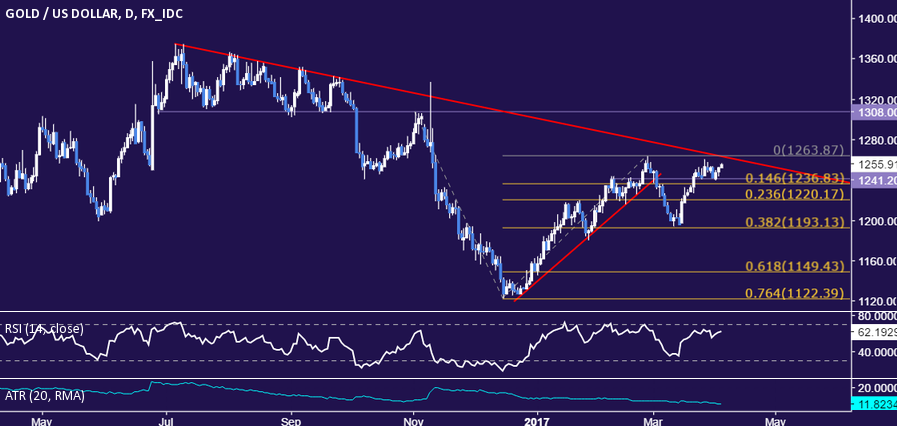
Chart created using TradingView
CRUDE OIL TECHNICAL ANALYSIS – Crude oil prices put in a Bearish Engulfing candlestick pattern, hinting a move lower may be ahead. A daily close back below resistance-turned-support at 50.11, the 38.2% Fibonacci retracement, opens the door for a retest of the 23.6% level at 48.95.

Chart created using TradingView
--- Written by Ilya Spivak, Currency Strategist for DailyFX.com
To receive Ilya's analysis directly via email, please SIGN UP HERE
Contact and follow Ilya on Twitter: @IlyaSpivak


