


Talking Points:
- Crude oil prices rise as weekly EIA inventories data tops forecasts
- Barren calendar may clear path for WTI to continue upward push
- Gold prices may not find potent cues in US GDP data, Fed-speak
Crude oil prices surged following supportive EIA inventory figures. Stockpiles added 867k barrels last week, a smaller increase than the expected 1.03 million barrel gain. Furthermore, refinery utilization continued to run well above forecasts. It registered at 1.9 percent, far greater than the 0.33 percent consensus view. This hints that bloated crude supplies may be drawn down significantly faster than previously thought. Indeed, gasoline and distillate inventories fell by more than was projected before the data crossed the wires.
A lull in top-tier event risk in the coming 24 hours offers little to encourage the rally to accelerate. By the same token however, it presents few potential roadblocks to continuation. With that in mind, established momentum may be sufficient to generate some near term follow-through but the magnitude of the upward push may be more restrained compared with yesterday’s performance.
Gold prices continued to mark time near one-month highs, digesting gains scored following last week’s failure of the AHCA healthcare reform bill. A revised set of fourth-quarter US GDP figures is in focus from here. The annualized growth rate is expected to be revised up from 1.9 to 2 percent. Absent a dramatic deviation from this baseline view, the modest improvement is probably insufficient to shake investors’ status-quo Fed policy outlook.
Another busy day on the Fed-speak docket may likewise pass with little fanfare. Traders have shrugged off pronouncements form policy officials for nearly two weeks now. Indeed, even yesterday’s overtly hawkish remarks from Eric Rosengren, President of the US central bank’s Boston branch, failed to make a lasting impression. On balance, that suggests consolidation may continue until a sufficiently potent catalyst emerges.
Have a question about trading crude oil and gold? Join a webinar and ask it live!
GOLD TECHNICAL ANALYSIS – Gold prices paused to digest gains ahead of major resistance in the 1263.87-65.23 area (February 27 high, 50% Fibonacci expansion). A daily close above this threshold sees the next upside barrier at 1281.88, the 61.8% Fib. Alternatively, a turn back below the 38.2% levelat 1248.58 – now recast as support – exposes the 23.6% expansion at 1227.99 anew.

Chart created using TradingView
CRUDE OIL TECHNICAL ANALYSIS – Crude oil prices launched upward, pushing through the top of a two-week consolidation range. Near-term resistance is now at 50.09, the 38.2% Fibonacci retracement, with a daily close above that exposing the 50% level at 51.03. Alternatively, a reversal back below the 23.6% Fib at 48.93 paves the way for a retest of the 47.70-48.22 area (trend line, 14.6% retracement).
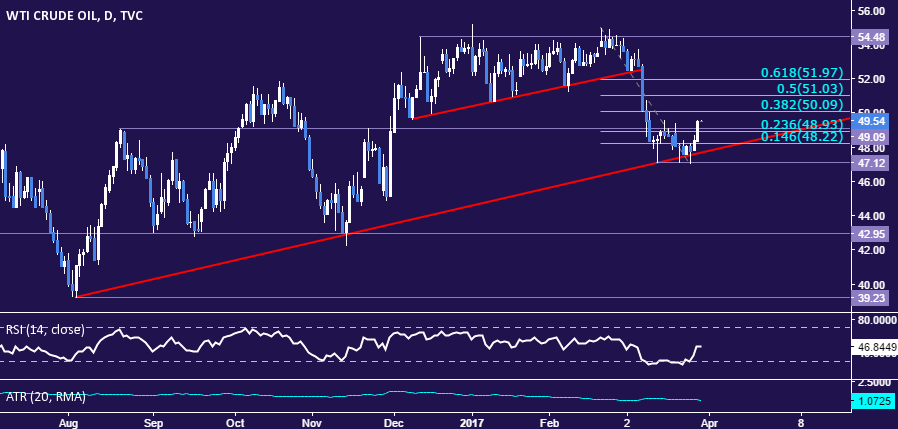
Chart created using TradingView
--- Written by Ilya Spivak, Currency Strategist for DailyFX.com
To receive Ilya's analysis directly via email, please SIGN UP HERE
Contact and follow Ilya on Twitter: @IlyaSpivak


