


Talking Points:
- Oil Prices fell on Tuesday as supply shortage from OPEC may not extend
- Gold on longest losing run since October
- Gold pushes lower on appreciating UST 10YR Yield & USD Ahead of NFP
- Oil Price Forecast: Is the Bear on the Way Back?
Blame the Americans. Specifically, the American shale oil producers for the recent breakdown in Oil prices. During CERAWeek in Houston, billionaire shale oilman, Harold Hamm said we could see the U.S. industry “kill” the oil market. Hamm sent a warning out that if Shale producers in North America aggressively boost production, which is now available at lower costs, as OPEC cuts back in an orderly fashion to balance the market, the oversupply would flood the market and bring the prices aggressively lower.
The breakdown in Oil price in early March has traveled more than 10% lower to the 200-DMA at $48.66/bbl Friday’s Baker Hughes Rig Count will be watched for the likely eighth weekly rise in active Oil rigs in the US. The surge higher has been very aggressive in US active rigs as we’ve seen a doubling in active rigs since last June. As active rigs in the US have risen, so have stockpiles, per the EIA, the week ended March 3 saw U.S. crude stockpiles rise by 8.21 million barrels to 528.4 million barrels, which was the ninth week of rising US Energy stocks.
Another appropriate concern for Oil Bulls is whether the DXY strength continues. For much of the breakdown in Crude from H2 2014-Q1 2016, we saw a nice correlation that recently has broken down. Should the correlation pick back up, we could see a stubborn USD, more on that later, act as a drag on Oil again (hat tip James Brodie, CMT).

Interested in Joining Our Analysts, Instructors, or Strategists For a Free Webinar? Register Here
Gold is falling too, but with less fanfare than Oil. On Thursday, Gold traded at its lowest level in five weeks on the back of impressive U.S. private jobs, which pushed down the price of Treasuries that lifted yields and further pushed the implied probability of a Federal Reserve Rate hike on March 15 to 100%.
However, it’s worth watching how NFP comes in relative to expectations because expectations have been consistently pushed higher. A datapointmiss, which is not expected after the largest private payroll gain in three years. While a rate hike in March is a foregone conclusion, the question that the market and Bullion traders will ponder and search for clues on is when the Fed will hike next. The faster approaching the next rate hike, the more critical it will be to watch the charts to see if traders are aggressively selling or holding the yellow metal as a form of portfolio insurance given the excessive valuations per some analysts’ views in the equities markets.
Are crude oil and gold prices matching DailyFX forecasts so far in 2017? Find out here !
GOLD TECHNICAL ANALYSIS – Gold pricescontinue to push lower, which aligns with the sentiment bias as retail traders hold 70% long positions as of Thursday. Many traders were watching $1,216.52/oz (Feb 15 low), which broke on Tuesday and have now turned their attention to the 50% retracement level at $1,193.13 of the December-February range from $1,122.51-$1,262.5 per oz.
Mid-day Thursday has the intraday low near $1,200/oz as 10-year Treasury yields continue their ascent. You will notice on the chart below that the 61.8% retracement of the December-February range from $1,122.51-$1,262.5 per oz at $1,176.46 aligns with the Ichimoku Cloud that price has recently traded above. A breakdown below the cloud would drop the confidence of an uptrend that began with an impulse higher in mid-December.
The breakdown and extreme reading in RSI(5) should also keep traders on the watch for a bounce. However, it’s the sustainability of the bounce that will be the real story. A weak bounce, followed by a breakdown below $1,176.46 should raise concerns that a larger sell-off could be developing.
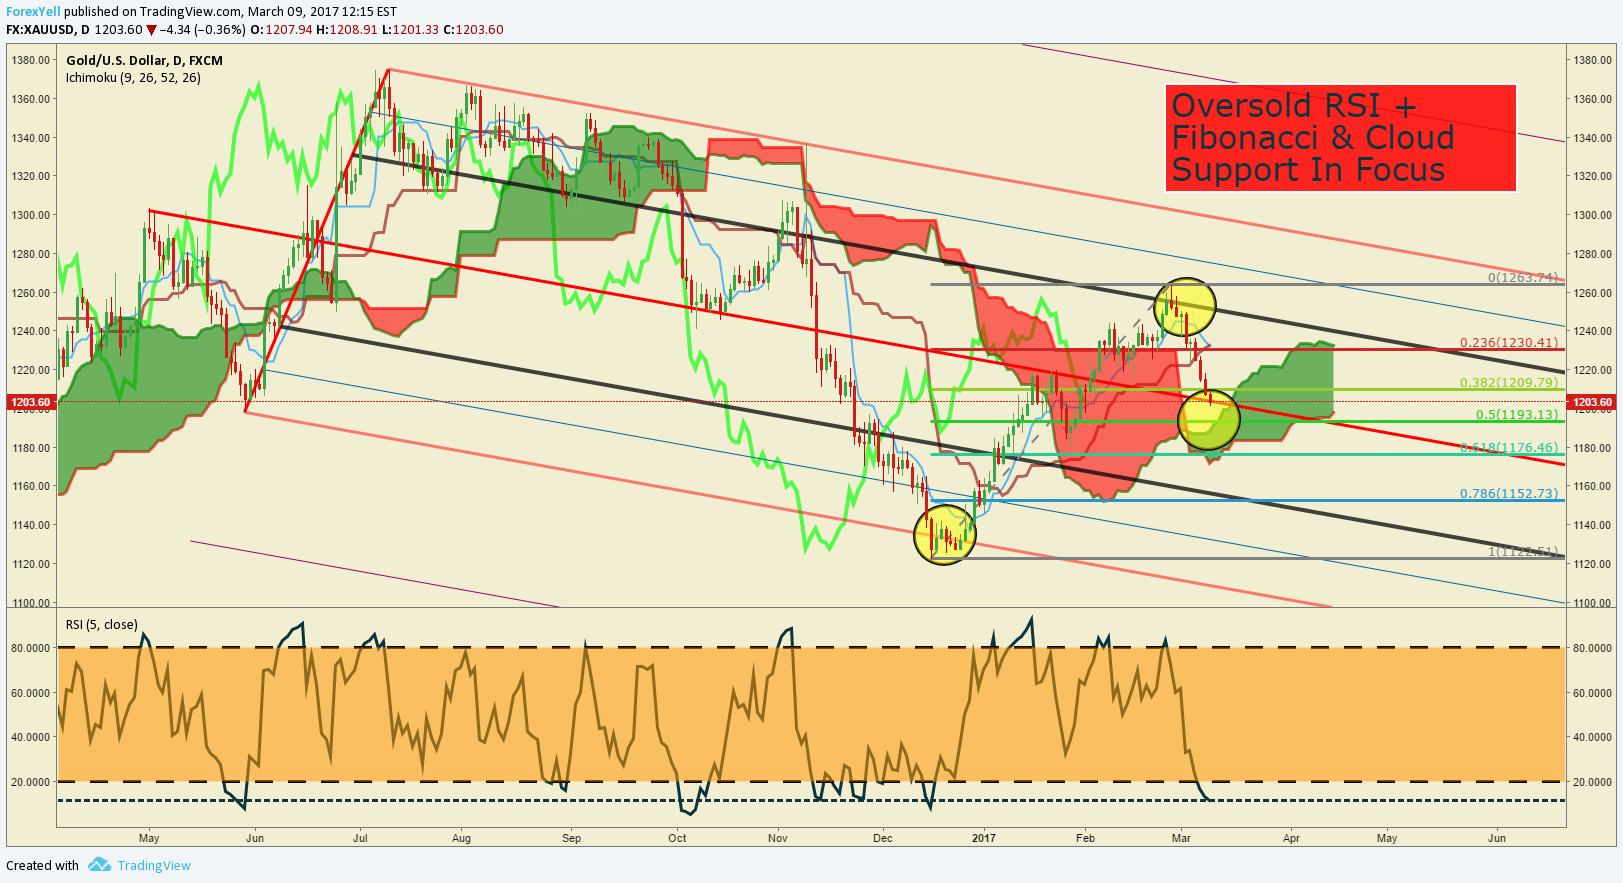
Chart created using TradingView
CRUDE OIL TECHNICAL ANALYSIS – The first drop below $50 since December turns trader focus toward a multitude of support that you can see on the chart below. First, you can see the price is at the bottom of the Ichimoku Cloud, The 200-DMA (Blue line) at 48.66, and a nice Trendline from the February and November 2016 low.
A 10% correction like we’ve seen in March could be painful, but not damaging to the overall trend over the last year. A further breakdown is naturally what would concern many technical traders as a push below the 200-DMA would do significant damage to the hope of a longer-term recovery. In addition to the support levels mentioned above, Thursday’s low price aligns with the 50% retracement of the November – February range. The levels of support worth watching that could still indicate the trend is bruised, but not broken would be a move down to $47.19 or $45.01 per barrel, which is the 61.8 and 78.6% retracement of the range. A break below these levels will bring back fears of a price breakdown similar in slope to what we saw in H2 2014-Q1 2016.

Chart created using TradingView
--- Written by Tyler Yell, CMT, Currency Analyst & Trading Instructor for DailyFX.com
Key LevelsOver the Next 48-hrs of Trading as ofThursday, March 9, 2017

For those interested in shorter-term levels of focus than the ones above, these levels signal important potential pivot levels over the next 48-hours of trading.
Contact and follow Tyler on Twitter: @ForexYell


