


Talking Points:
- Gold prices plummet as tax cut hopes revive the “Trump trade”
- White House news-flow ma overshadow consumer confidence data
- Crude oil prices erase post-API drop, await supply/demand cues
The so-called “Trump trade” staged a forceful comeback after the White House said it will announce the most ambitious tax reform plan since that of Ronald Reagan in the coming weeks. The US Dollar rose alongside Treasury bond yields on hopes that cut in corporate rates – a frequent talking point on the campaign trail – will boost growth and inflation, pushing the Fed into a steep rate hike cycle. Predictably enough, gold prices slumped against this backdrop.
Looking ahead, a relatively quiet US economic calendar is headlined by February’s University of Michigan consumer confidence report. Sentiment is expected to tick down for the first time in four months. News-flow from Washington, DC may overshadow other considerations just as the vaguest hint of tax reform bewitched the markets despite rather cautious comments from the Fed’s Jim Bullard and Charles Evans. S&P 500 futures are pointing higher, hinting the chipper mood is poised to carry forward.
For their part, crude oil prices continued to drift upward for a second day, with the WTI benchmark erasing losses suffered after the release of API inventory flow data earlier in the week. The IEA monthly oil market report and Baker Hughesrig count data counting the number of active US crude extraction points for the past week are in focus from here. Taken together, the releases will help drive speculation about the conflicting influence of OPEC’s supply cuts and resurgent North American production.
Want to discuss the outlook for crude oil and gold prices with a DailyFX analyst? Join a webinar !
GOLD TECHNICAL ANALYSIS – Gold prices put in a Bearish Engulfing candlestick pattern, hinting a turn lower may be ahead. A daily close below the 38.2% Fibonacci retracement at 1219.20 exposes the 23.6% level at 1182.36. Alternatively, a push above the 50% Fib at 1248.98 targets the 61.8% retracement at 1278.76.
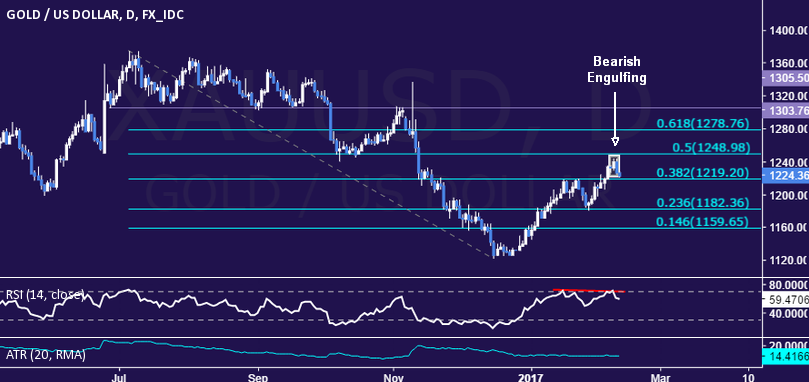
Chart created using TradingView
CRUDE OIL TECHNICAL ANALYSIS – Crude oil prices continued to recover after testing trend line support bedeviling sellers for the past two months. From here, a break above range resistance at 53.86 exposes the 55.21-65 area (January 3 high, 38.2% Fibonacci expansion). Alternatively, a reversal through the trend line (now at 51.69) initially targets the 38.2% Fib retracement at 50.25.
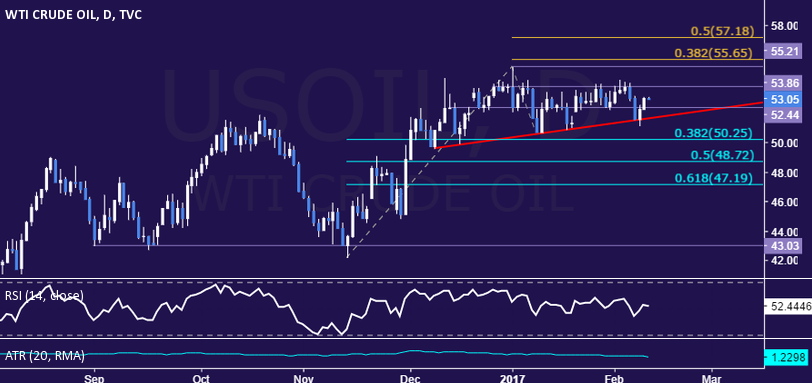
Chart created using TradingView
--- Written by Ilya Spivak, Currency Strategist for DailyFX.com
To receive Ilya's analysis directly via email, please SIGN UP HERE
Contact and follow Ilya on Twitter: @IlyaSpivak


