


Talking Points:
- Crude oil prices drop on API inventory data, EIA output forecast
- Gold prices trim intraday drop after JOLTS report underwhelms
- DOE inventories report, White House news-flow in the spotlight
Crude oil prices build on overnight losses suffered at the hands of a recovering US Dollar after API reported the largest weekly inventory build in three months. An EIA report upgrading the 2018 output forecast to 9.53m from 9.3m barrels per day projected in January probably didn’t help matters either (although the 2017 outlook was slightly lowered to 8.98m from 9m b/d).
Gold prices continued to reflect the metal’s role as anti-fiat asset, dropping as the greenback launched upward but managing to reclaim most lost ground as it lost steam and eased back from session highs. The US currency fell alongside Treasury bond yields after JOLTS data reportedly prized by Fed Chair Janet Yellen showed fewer job openings (5501) than economists expected (5580) in December, cooling rate hike bets.
From here, the DOE weekly crude oil inventory flow report is in focus. Stockpiles are expected to rise by 2.695m barrels. The WTI contract may suffer deeper losses if official fall closer in line the far larger API estimate of a 14.2m increase. Needless to say, news-flow coming from the White House remains an important consideration as well.
Have a question about trading commodity markets? Join a Q&A webinar and ask them live!
GOLD TECHNICAL ANALYSIS – Gold prices paused to consolidate gains after rising to the highest level in three months. From here, a daily close above the 61.8% Fibonacci expansion at 1240.88 paves the way for a test of the 76.4% level at 1255.08. Alternatively, a turn back below the 50% Fib at 1229.40 exposes the 38.2% expansion at 1217.91.

Chart created using TradingView
CRUDE OIL TECHNICAL ANALYSIS – Crude oil prices turned sharply lower, posting the largest decline in a month. From here, a daily close below trend line support at 51.69 opens the door for a test of the 38.2% Fibonacci retracement at 50.25. Alternatively, a move back above support-turned-resistance at 52.44 paves the way for another challenge of 53.86, the December 27 close.
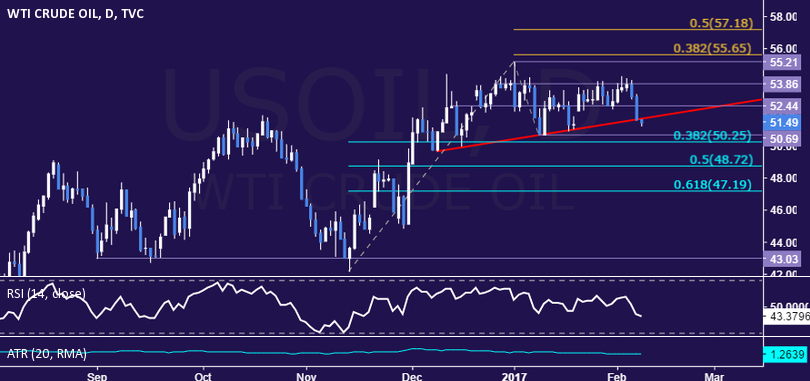
Chart created using TradingView
--- Written by Ilya Spivak, Currency Strategist for DailyFX.com
To receive Ilya's analysis directly via email, please SIGN UP HERE
Contact and follow Ilya on Twitter: @IlyaSpivak


