


Talking Points:
- Crude oil prices rise, correcting after yesterday’s selloff
- Gold prices gain as FOMC minutes dent rate hike outlook
- ISM and ADP may see gold rise further as EIA boosts oil
Crude oil prices turned higher in a move that seemed corrective after yesterday’s sharp selloff. API data showing inventories fell 7.43 million barrels last week probably didn’t hurt either, but much of the day’s advance had already occurred by the time the release crossed the wires.
Gold prices pushed upward as expected following the release of minutes from December’s FOMC meeting. Policymakers seemed far less convinced of the need for an aggressive rate hike cycle than recent market moves implied, weighing on the US Dollar and stoking anti-fiat demand.
The metal may continue higher as data form ISM and ADP cross the wires. The two reports are tipped to show that US job creation and service-sector activity growth slowed in December. The WTI contract may likewise extend gains if official EIA inventories data sees a larger draw then the 1.7mb drop expected.
See the schedule of upcoming webinars and join us LIVE to follow the financial markets!
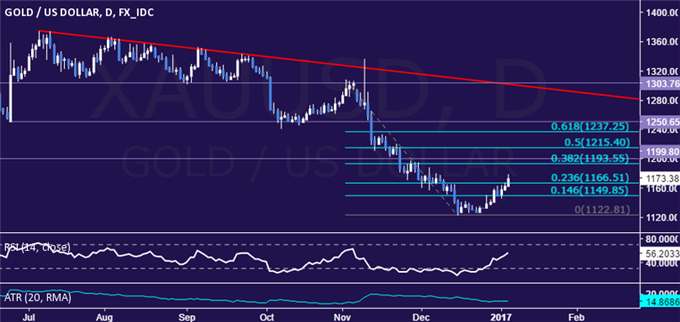
GOLD TECHNICAL ANALYSIS – Gold prices look poised to retest the $1200/oz figure following a break of resistance at 1166.51, the 23.6% Fibonacci retracement. From here, a daily close above the 1193.55-99.80 area (38.2% level, May 30 low) exposes the 50% Fib at 1215.40. Alternatively, a turn back below 1166.51 targets the 14.6% Fib at 1149.85.
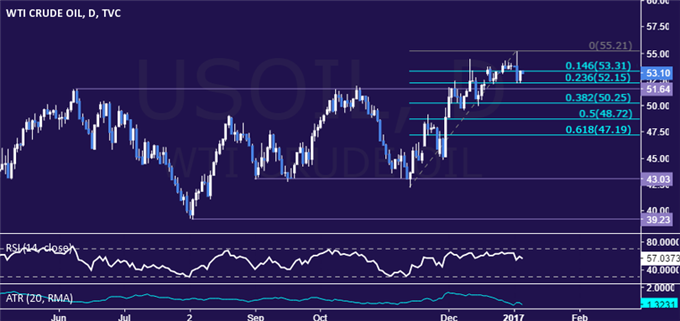
CRUDE OIL TECHNICAL ANALYSIS – Crude oil prices found support above the $51/barrel figure. A daily close below resistance-turned-support at 51.64 opens the door for a test of the 38.2% Fibonacci retracementat 50.25. Alternatively, a push back above the 14.6% Fib at 53.31 clears the way for a retest of the January 3 high at 55.21.
--- Written by Ilya Spivak, Currency Strategist for DailyFX.com
To receive Ilya's analysis directly via email, please SIGN UP HERE
Contact and follow Ilya on Twitter: @IlyaSpivak


