


Talking Points:
- Gold prices rise most in 3 months after US trade data
- Outsized gold move probably reflects market illiquidity
- Crude oil prices fall as EIA reports inventory increase
Gold prices rose, posting the largest daily gain in three months. A concurrent side-by-side decline in the US Dollar and front-end Treasury bond yields points to an increase in the relative appeal of anti-fiat and non-interest-bearing assets. That move followed the release of US trade data that showed the deficit unexpectedly widened to $65.3 billion in November, the largest since March 2015. Economists projected that the shortfall would narrow from $62 to $61.6 billion ahead of the announcement.
While certainly important, trade data is an infrequent driver of immediate volatility, especially when the numbers on offer fall broadly within recent trends (as November’s figures did). With that in mind, the outsized response from financial markets seems to reflect illiquid holiday trading conditions rather than true conviction from investors. Indeed, follow-through may be lackluster as the spotlight returns to the on-coming pivot in US fiscal policy and its implications for the trajectory of Fed rate hikes in the days and weeks ahead.
Crude oil prices edged lower after EIA inventory data showed stockpiles unexpectedly grew by 614k barrels last week. Economists were expecting a 1.5 million barrel drawdown. The WTI benchmark continues to hover near monthly highs ahead of implementation of the OPEC’s output cut scheme next month. That seems likely to continue through the final hours of the trading week, with traders probably reluctant to commit to a directional bias ahead of the New Year break.
See the schedule of upcoming webinars and join us LIVE to follow the financial markets!
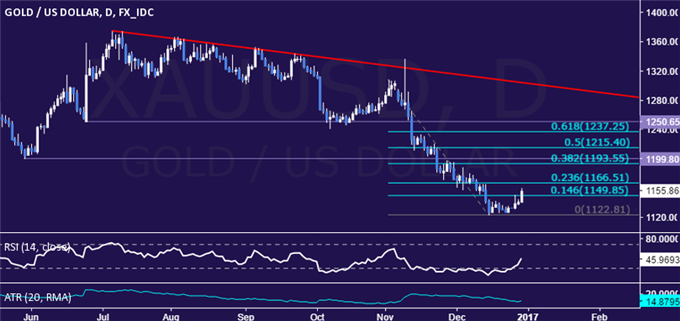
GOLD TECHNICAL ANALYSIS – Gold prices are poised to clear resistance at 1149.85, the 14.6% Fibonacci retracement, opening the door for a test of the 23.6% level at 1166.51. Alternatively, a turn back below 1149.85 sees the next downside barrier at 1122.81, the December 15 low.
CRUDE OIL TECHNICAL ANALYSIS – Crude oil prices remain stuck near December’s high. A daily close above resistance in the 54.66-55.28 area (38.2% Fibonacci expansion, trend line) targets the 50% level at 56.11. Alternatively, a turn back below horizontal pivot support at 51.91 targets the 38.2% Fib retracement at 49.80.

--- Written by Ilya Spivak, Currency Strategist for DailyFX.com
To receive Ilya's analysis directly via email, please SIGN UP HERE
Contact and follow Ilya on Twitter: @IlyaSpivak


