


Talking Points:
- Gold prices soar as Donald Trump claims victory in US election
- Crude oil prices sustain bullish chart setup through intraday drop
- Risk-off mood to continue as markets grapple with vote outcome
Gold prices soared as Donald Trump emerged victorious from the US presidential election. The outcome triggered widespread risk aversion, as expected. Markets seemed to conclude that the Fed is less likely to make good on rate speculation in this scenario, boosting anti-fiat demand for the yellow metal. Crude oil prices fell alongside shares as sentiment soured.
The fallout from the vote’s outcome is likely to remain as the main driver of price action in the hours ahead. S&P 500 futures are pointing decidedly lower, making the case for the continuation of risk-off dynamics in the near term. The extent of follow-through is uncertain however and sensitivity to stray headline risk seems likely to stay elevated in the near term.
See the schedule of upcoming webinars and join us LIVE to follow the financial markets!
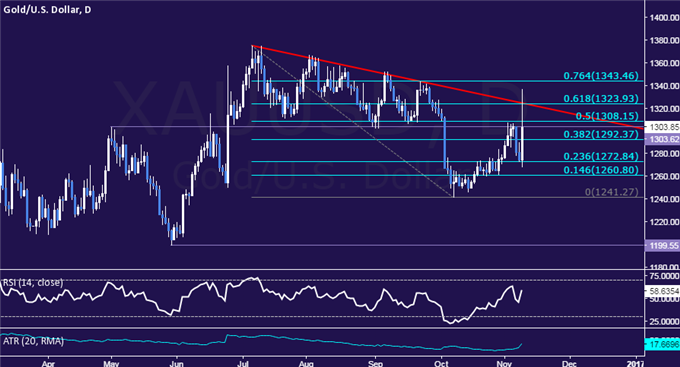
GOLD TECHNICAL ANALYSIS – Gold prices attempted to breach trend resistance but the $1300/oz figures continues to act as formidable resistance. A daily close above the 1303.62-08.15 area (May 2 high, 50% Fibonacci retracement) exposes the 61.8% level at 1323.93. Alternatively, a reversal below the 38.2% Fib at 1292.37 targets the 23.6% Fib at 1272.84.
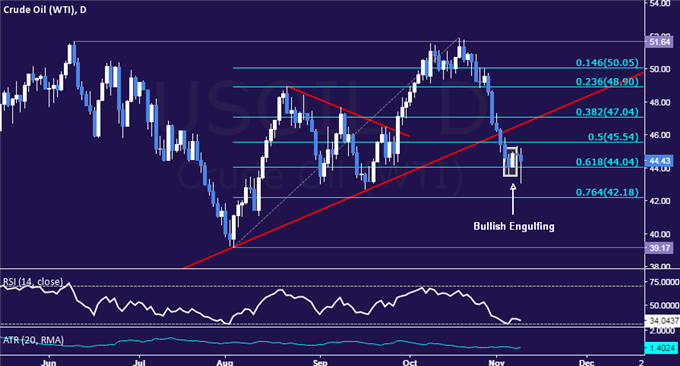
CRUDE OIL TECHNICAL ANALYSIS – Crude oil prices put in a Bullish Engulfing candlestick pattern, hinting a bounce may be ahead. A daily close above the 50% Fibonacci retracement at 45.54 exposes the 46.51-47.04 area (trend line support-turned-resistance, 38.2% level). Alternatively, a move below the 61.8% Fib at 44.04 targets the 76.4 retracement at 42.18.
--- Written by Ilya Spivak, Currency Strategist for DailyFX.com
To receive Ilya's analysis directly via email, please SIGN UP HERE
Contact and follow Ilya on Twitter: @IlyaSpivak


