


Talking Points:
- Gold prices rise as US Dollar, Treasury bond yields fall on soft data
- Crude oil prices decline on API data, fears of OPEC deal unraveling
- EIA report in focus for oil; gold may struggle to sustain momentum
Gold prices traded higher as the US Dollar weakened against its major counterparts and Treasury bond yields fell following disappointing US consumer confidence data. This bolstered the relative appeal of anti-fiat and non-interest-bearing assets. Near-term follow-through may prove lacking however as traders await Fed policy cues from Friday’s release of third-quarter US GDP data before showing directional commitment.
Crude oil prices fell amid fears that an OPEC deal to cut output is unraveling as cartel Secretary-General Barkindo struggled to overcome demands for an exemption from Iraq. Selling pressure was amplified after Russian OPEC envoy Vladimir Voronkov said cutting production is “not an option”, according to Interfax, while API reported that US inventories rose by 4.8 million barrels last week. Official EIA inventories data is now in focus, with 2 million barrel build projected by economists.
Will recent crude oil and gold trends continue into the end of the year? See our forecast to find out!
GOLD TECHNICAL ANALYSIS – Gold prices continued to push higher having bottomed as expected after hitting a four-month low. Near-term resistance is in the 1272.84-74.29 area (October 20 high, 23.6% Fibonacci retracement), with a daily close above that exposing the 38.2% level at 1292.37. Alternatively, a move below support marked by the 14.6% Fib at 1260.80 paves the way for another challenge of the June 24 low at 1250.11.

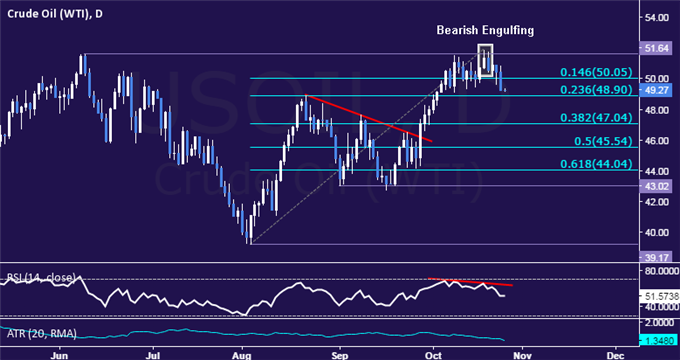
CRUDE OIL TECHNICAL ANALYSIS – Crude oil prices declined as expected, seemingly carving out a double top. From here, breaking below the 23.6%Fibonacci retracement at 48.90 exposes the 38.2% level at 47.04. Alternatively, a reversal back above the14.6% Fibat 50.05 opens the door for a retest of the June 9 top at 51.64.
--- Written by Ilya Spivak, Currency Strategist for DailyFX.com
To receive Ilya's analysis directly via email, please SIGN UP HERE
Contact and follow Ilya on Twitter: @IlyaSpivak


