


Talking Points:
- Crude Oil Price: Most Encouraging Price Action Near $50/bbl Since 03/2015
- Gold Price: Gold & Yen Higher on Worry About Global Demand Despite Negative Rates
- Copper Breaking Down From Consolidation Pattern After China Cuts Imports For Sixth Month
Crude Oil prices have stabilized near the $50/bbl, but a larger look at what is going on will show you that prices seem for either a strong pivot higher or lower. The simple argument for a move lower is that the OPEC agreement will not come to fruition and the price of Oil will fall further away from the June high of $51.64/bbl. Global Oil supplies are rising while the world awaits the November OPEC meeting to see whether or not OPEC will reach an agreement about how much and who of the 14-member OPEC group will cut. However, we recently saw the China’s Crude Oil exports hit a record high so that an agreed-upon cut of production with rising demand could continue to support and lift the price of Oil higher. Thursday’s U.S. DoE Inventory showed a rise in aggregate U.S. Crude Inventories of 4.85Mb/l vs. expectations of 2Mb/l.
Gold prices are pulling off four-month lows on the back of weak data around Chinese Exports, which says more about global demand than China. In addition to disappointing trade data out of China, we recently heard from the September FOMC Minutes that the Fed is getting closer to a rate hike as December approaches. A little less than a year ago, the markets were also embracing for a rate hike from the Fed at the same time the global economy was slowing down, which caused China to devalue the Yuan on January’s opening trading day of 2016 to align with ‘market forces.’ Such a similar event would likely support Gold and bring the price back above $1,300/oz.
The US Dollar will remain a critical factor for both Crude Oil and the price of Gold as USD strength tends to align with weakness in the commodity sector. In yesterday’s note, we shared how steep the slope of the ascent in US Dollar was from the September low that brought in a rise of ~3%, and could encourage jaw-boning from Fed speakers to limit USD strength ahead of the anticipated rate hike on December 14. Friday will provide an opportunity for USD volatility thanks to Janet Yellen’s speech at the Boston Fed Conference alongside one of three dissenters at the September FOMC meeting, Eric Rosengren. Friday will also bring U.S. Retail Sales data and finalized PPI.
Another metal in focus has been Dr. Copper. The Copper price has recently pushed lower toward the support of $2.00. Recent Chinese trade data points to weakness on a global macro scale and implies falling demand for industrial metals like copper. We’ve also seen Yuan weakness and a stronger US Dollar that may also be placing pressure on Copper. From a technical perspective, Copper appears to be finishing out a triangle consolidation. Thursday’s break below 2.145 would open up a continuation of the downtrend and could be extended if USD strength continues.
Access Our Free Q4 Trading Guides That Focus On Tradeable Themes Here
GOLD TECHNICAL ANALYSIS – It’s too early to say whether or not the drop from September 21 in the price of Gold by $100/oz is over. From a technical perspective, today’s slowdown may be a short-term consolidation before the next leg lower. We’ve recently broken below the 200-DMA, which should discourage short-term bullishness.
However, the next leg lower has a log of support near the March/May low price zone of $1,215/1200 per oz. zone. As of Thursday, the price is sitting near the 38.2% retracement of the December-July range at 1,249. A strong breakdown on the back of risk-on sentiment or a stronger US Dollar like we’ve seen over the last two weeks could quickly take us down to the next zone of support where we see the 50% retracement of the 2016 move higher.
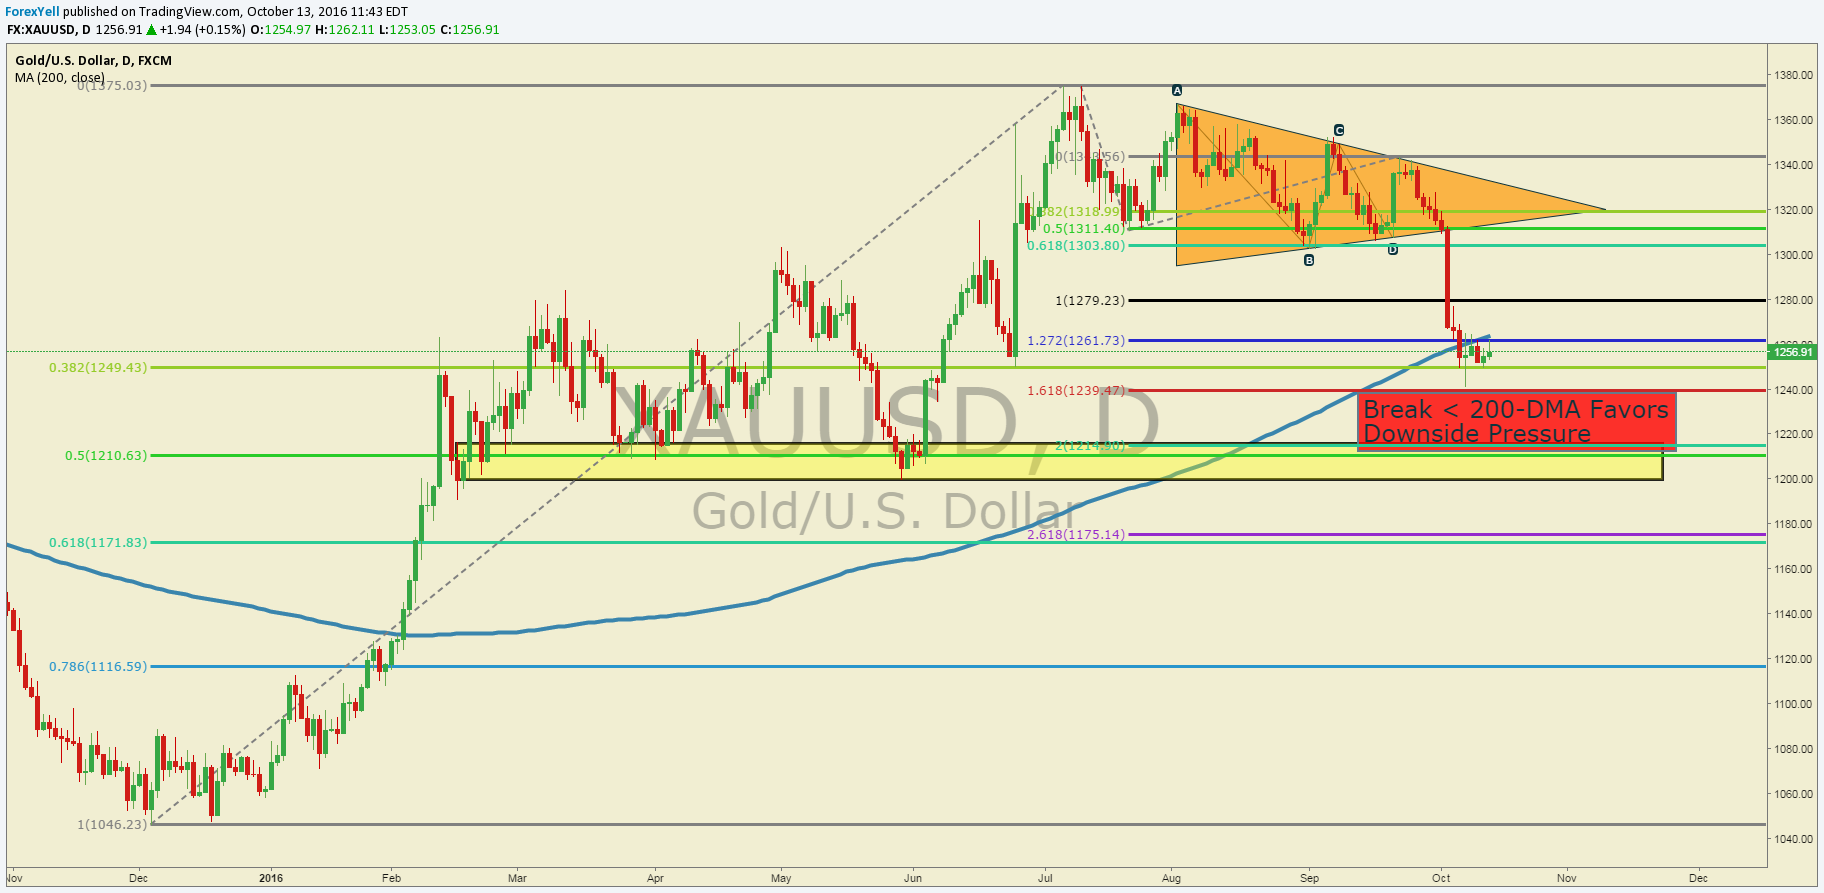
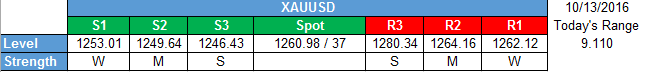
Short-Term Gold Price Support & Resistance Levels:
CRUDE OIL TECHNICAL ANALYSIS – Crude Oil prices have oscillated around $50/bbl on Thursday, but found some pressure on the release of the aggressive rise of nearly 5M barrels of inventory from the DoE data. Crude Oil price remains above trendline support drawn from the February low and off the August low (currently near $46/bbl) which should favor a Bullish bias until this trend line is broken. A shorter-term support level worth watching is Friday’s low at $49.12 that resulted in a Bullish Key Day. The next zone of support is the 38.2-61.8% retracement zone of the September 27- October 10 move higher.
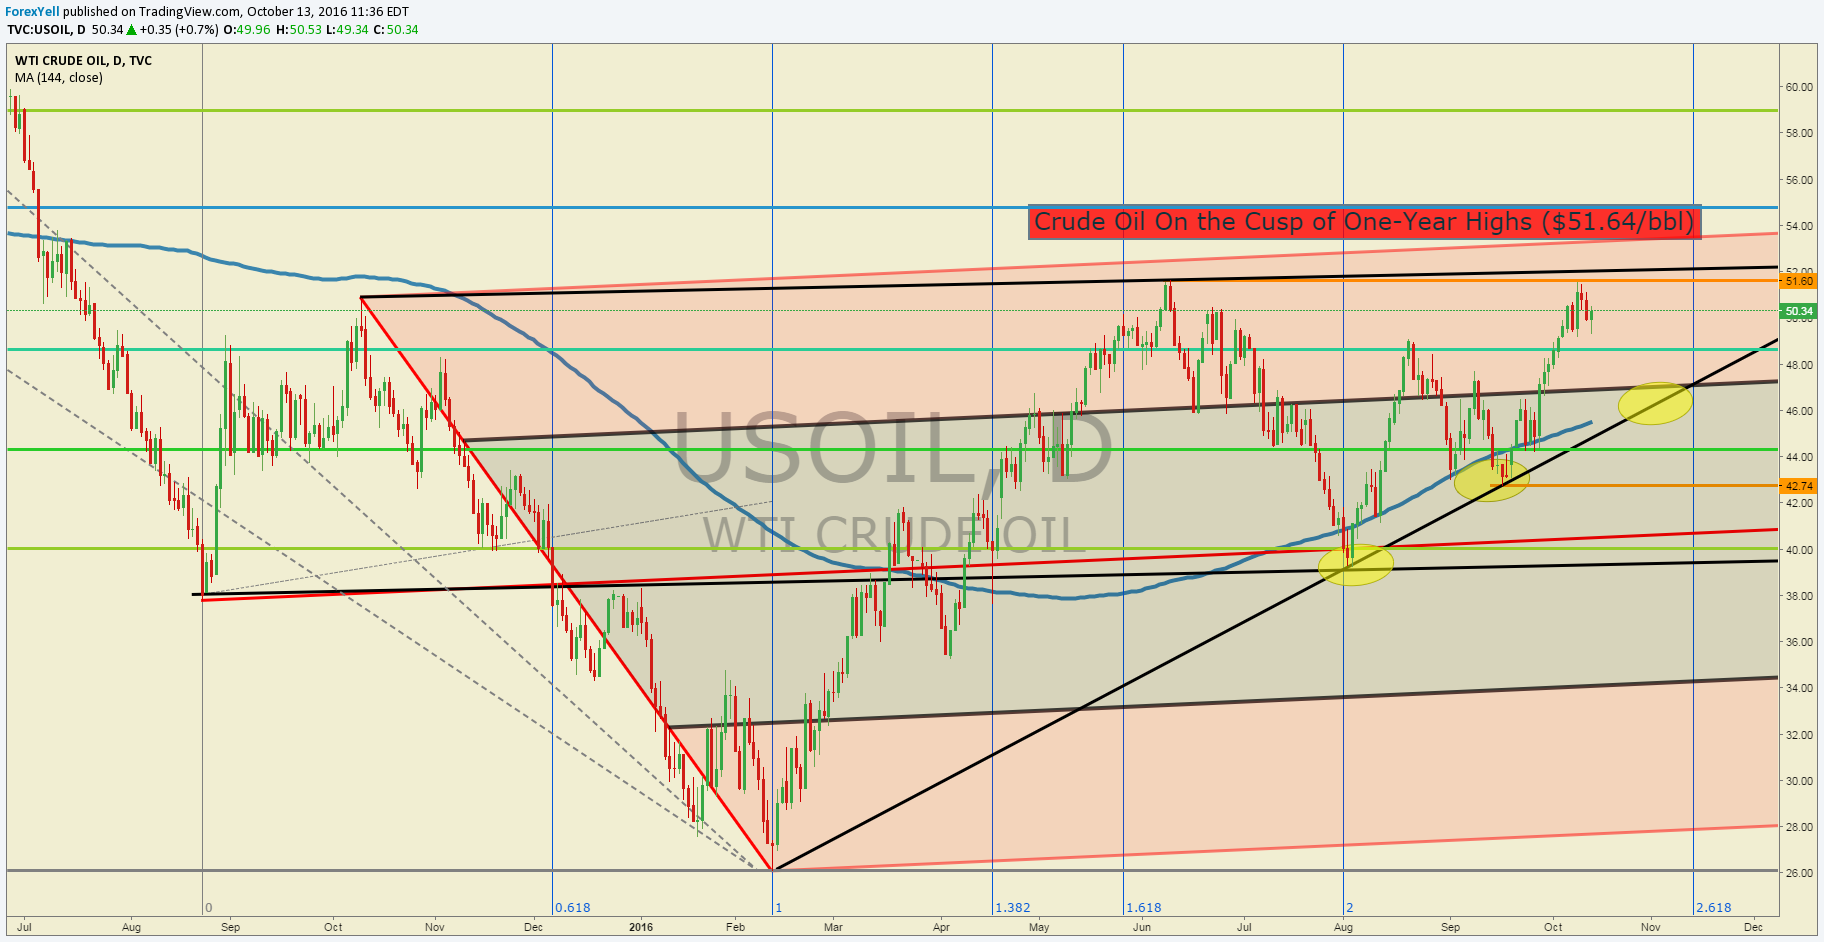
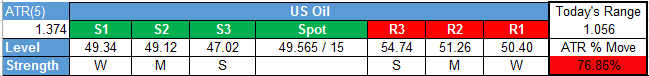
Short-Term Crude Oil Price Support & Resistance Levels:
--- Written by Tyler Yell, CMT Currency Analyst for DailyFX.com
To receive Tyler’s analysis directly via email, please SIGN UP HERE
Contact and follow Tyler on Twitter: @ForexYell


