


Talking Points:
- Crude oil prices stall after hitting four-month high on Russia, OPEC hopes
- Gold prices marked time as September FOMC meeting minutes loom ahead
- Commodities likely to fall as US Dollar gains if Fed bolsters rate hike bets
Crude oil prices paused to consolidate gains after rising to the highest level in four months yesterday. The WTI benchmark soared yesterday after Russia signaled that it may cooperate with an OPEC output reduction scheme that emerged last month. Cartel members are due to decide on supply quotas at a meeting in November.
Gold prices marked time as markets looked ahead to the release of minutes from September’s FOMC meeting. Traders are looking to 2016 interest rate hike probability after Fed Chair Yellen all but promised tightening as long as current economic trends remained unchanged (as expected). The priced-in likelihood of an increase now stands at 68 percent, the highest in four months.
Further confirmation of the central bank’s conviction is likely to boost the US Dollar and undermine demand for anti-fiat and non-interest-bearing assets, pushing gold downward. Crude oil may also find its way downward as a stronger greenback applies de-facto selling pressure to USD-denominated assets. The release of weekly API inventory data may disrupt transmission of Fed-inspired moves however.
Will gold prices continue to decline in the fourth quarter? See our forecast to find out!
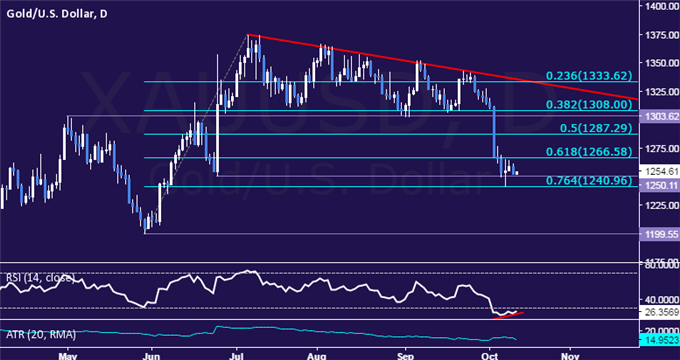
GOLD TECHNICAL ANALYSIS – Gold prices continue to mark time after slipping to a four-month low above the 1200/oz figure. A daily close below the 1240.96-50.11 area (76.4% Fibonacci retracement, June 24 low) targets the May 30 bottom at 1199.55. Early signs of positive RSI divergence warn a bounce may be ahead however. A move back above the 61.8% Fib at 1266.58 exposes the 50% level at 1287.29.
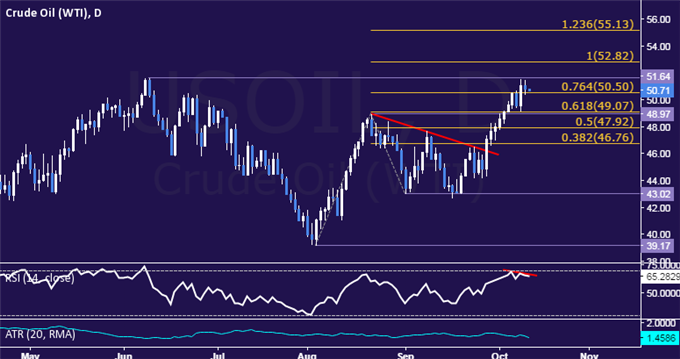
CRUDE OIL TECHNICAL ANALYSIS – Crude oil prices have moved to challenge critical resistance at 51.64, the June 9 high, with negative RSI divergence warning of ebbing upside momentum and hinting that a double top may be in the works. A daily close below the 76.4% Fibonacci expansion at 50.50 targets the 48.97-49.07 area (August 23 high, 61.8% level).Alternatively, a breach of resistance exposes the 100% Fib at 52.82.
--- Written by Ilya Spivak, Currency Strategist for DailyFX.com
To receive Ilya's analysis directly via email, please SIGN UP HERE
Contact and follow Ilya on Twitter: @IlyaSpivak


