


Talking Points:
- Crude oil prices carve out bearish chart setup below $48/bbl
- Gold prices fall for third day on swelling Fed rate hike bets
- Fed’s Brainard in focus as markets gauge FOMC consensus
Gold prices declined as the US Dollar rose alongside front-end Treasury bond yields as hawkish commentary from Fed officials stoked imminent rate hike speculation, as expected. Crude oil prices were also caught up in the move, with a stronger greenback applying de-facto selling pressure to the USD-denominated WTI benchmark.
The outlook for US monetary policy is likely to retain the spotlight in the near term. All eyes are on a hastily scheduled speech from Fed Governor Lael Brainard, by most accounts the leading dove on the rate-setting FOMC committee. If she echoes her colleagues’ saber-rattlingin recent weeks, the markets may surmise that the group is truly of one mind about stimulus withdrawal, sending commodity prices lower still.
What do past gold and crude oil price patterns hint about on-coming moves? Find out here !
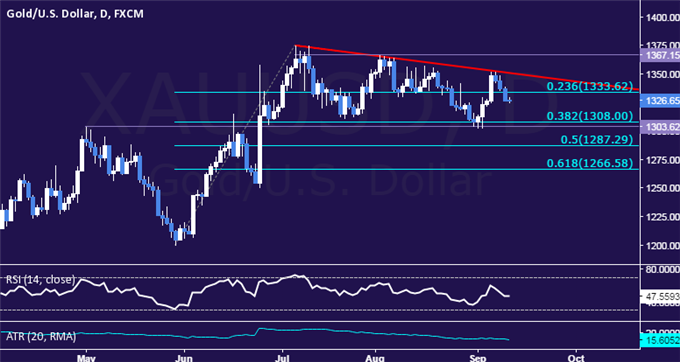
GOLD TECHNICAL ANALYSIS – Gold prices are retreating after testing a falling trend line capping gains since early July. From here, a daily close below the 1303.62-08.00 area (May 2 high, 38.2% Fibonacci retracement) exposes the 50% level at 1287.29. Alternatively, a reversal back above the 23.6% Fib at 1333.62 opens the door for a retest of the trend line, now at 1351.04.
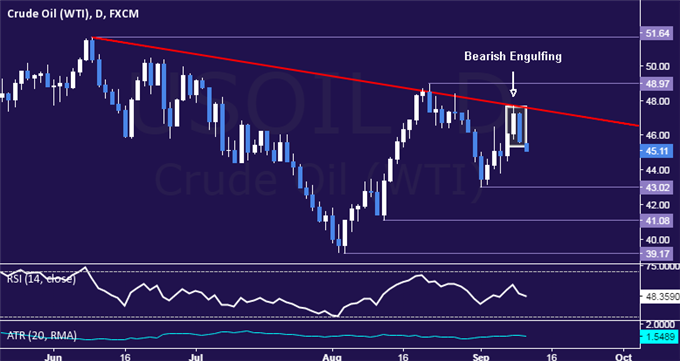
CRUDE OIL TECHNICAL ANALYSIS – Crude oil prices put in a Bearish Engulfing candlestick pattern, hinting a move lower is ahead. A daily close below the September 1 low at 43.02 exposes the August 11 bottom at 41.08. Alternatively, a push above falling trend line resistance – now at 47.60 – targets the August 22 high at 48.97.
--- Written by Ilya Spivak, Currency Strategist for DailyFX.com
To receive Ilya's analysis directly via email, please SIGN UP HERE
Contact and follow Ilya on Twitter: @IlyaSpivak


