


Talking Points:
- Gold prices breach June high, fall short of convincing breakout
- Crude oil prices may extend bounce on weekly inventory figures
- S&P 500 futures hint at consolidation as US jobs report looms
Crude oil prices recovered and gold prices retreated from session highs yesterday after a better-than-expected US ISM Non-manufacturing survey bolstered market-wide risk appetite. Looking ahead, a relatively quiet day on the economic data docket may make for a consolidative tone as investors look ahead to Friday’s US jobs report. Indeed, S&P 500 futures are trading flat ahead of the opening bell on Wall Street, signaling a neutral posture on sentiment trends.
The weekly EIA inventories report is expected to show crude oil stockpiles were drawn down by 2.08 million barrels. Private-sector estimates released by API point to a larger 6.7 million barrel reduction, which may offer a further lift to the WTI contract. Lasting follow-through seems unlikely without support from risk appetite however.
Track pivotal short-term gold and crude oil technical patterns with the GSI indicator !
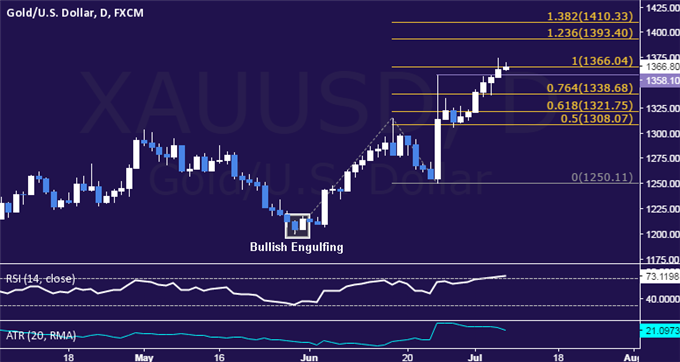
GOLD TECHNICAL ANALYSIS – Gold prices edged past June’s swing high but fell short of clearing the 100% Fibonacci expansion at 1366.04. From here, a daily close above this barrier targets the 123.6% level at 1393.40. Alternatively, a move below the 76.4% Fib at 1338.68 exposes the 61.8% expansion at 1321.75.
CRUDE OIL TECHNICAL ANALYSIS – Crude oil prices managed to hold up at familiar range support once again. From here, a daily close below 45.60, the 23.6% Fibonacci retracement, exposes the 38.2% level at 41.86. Alternatively, a breach of trend line resistance at 49.09 targets the 23.6% Fib expansionat 51.86.

--- Written by Ilya Spivak, Currency Strategist for DailyFX.com
To receive Ilya's analysis directly via email, please SIGN UP HERE
Contact and follow Ilya on Twitter: @IlyaSpivak


