


Talking Points:
- Crude oil prices break four-month rising trend, aim below $46/bbl
- Gold prices soar past May high to hit strongest level since Aug’14
- “Brexit”-linked risk aversion continues to define market dynamics
Crude oil prices remain vulnerable as “Brexit”-linked risk aversion continues to sweep financial markets. S&P 500 futures are pointing decidedly lower ahead of the opening bell on Wall Street, warning that the sentiment-linked WTI contract is set to continue following shares lower.
Meanwhile, gold prices are on pace to secure their longest winning streak in four months with as prices soar following what the markets have concluded was a dovish FOMC policy announcement. The risk-off environment may boost upward pressure as haven flows buoy bonds and send yields lower, bolstering the appeal of non-interest-bearing assets.
On the data front, US CPI figures are expected to show the core year-on-year inflation rate rose to 2.2 percent in May after falling in the prior two months. The outcome may be largely overlooked absent a sharp deviation from consensus forecasts however. Indeed, investors were decidedly not impressed with an upgrade of the Fed’s price growth outlook yesterday.
Are gold and crude oil prices matching DailyFX analysts’ expectations? Find out here !
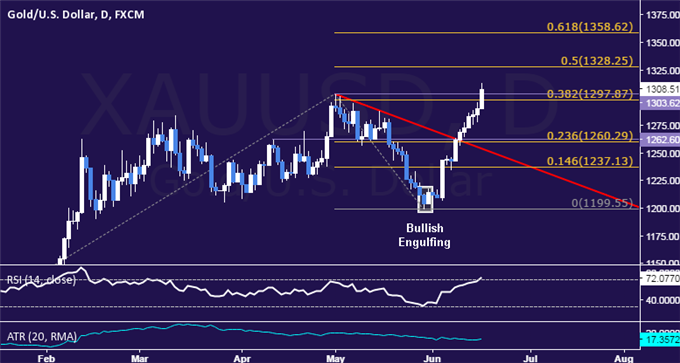
GOLD TECHNICAL ANALYSIS – Gold prices are probing above May’s swing high to touch the highest level since August 2014. The metal turned higher as expected after putting in a Bullish Engulfing candlestick pattern. A daily close above the 1297.87-1303.62 area (38.2% Fibonacci expansion, May 2) exposes the 50% level at 1328.25. Alternatively, a move back below the 23.6% Fib at 1260.29 targets the 14.6% expansion at 1237.13.
CRUDE OIL TECHNICAL ANALYSIS – Crude oil prices appear to have broken the rising trend set from swing lows in mid-February having topped as expected after forming a Bearish Engulfing candlestick pattern. A daily close below the 23.6% Fibonacci retracement at 45.60 exposes the 38.2% level at 41.86. Alternatively, a reversal above the 14.6% Fib at 47.90 targets a horizontal pivot at 49.73.

--- Written by Ilya Spivak, Currency Strategist for DailyFX.com
To receive Ilya's analysis directly via email, please SIGN UP HERE
Contact and follow Ilya on Twitter: @IlyaSpivak


