


Talking Points:
- Gold rode the risk-averse wave to highest level since June
- Oil held on to modest recovery before weekly data from API then EIA
- Copper resumed mildly amid sideways trading above trend line support
Gold price surged above 1200 for the first time since June 2015 as yesterday’s risk rout swiped through London and New York sessions. The safe haven asset hovers in 1190s for the majority of today as Asian equities plunge deep in the red. Australia’s ASX lost nearly 3 percent and Japan’s Nikkei lost 5 percent.
Yields in the US and Japan slumped consequently to global economic worries and Japan’s negative interest rate policy. 10-year Japan yield dip under 0 while JPY reached the strongest since 2014. Similar forewarning from Swiss central bank (SNB) and the ECB further instilled a risk-averse sentiment.
In this context, gold, yen currency, and bonds should find good support in the short term. At least until market liquidity enhances next week in Asia Pacific, which may facilitate dip buying in favour of a two-way market.
Oil price held on to its modest recovery with wild intraday volatility, after yesterday’s close under $30. Oil suffers inherent weakness as part of a slump in emerging market currencies, stocks, and commodities. Nevertheless, the recent lows at 29.25 and 27.56 are likely bottom prices for now. Moreover oil and commodities should establish a floor given renewed softness in USD, as DXY dollar index nears October’s low.
Copper price also recovered mildly and the metal retained above its trend line support. Copper has not swung about as much as oil, thanks to low liquidity with market closed in the number one consumer China. However a current credit-tightening in emerging markets may negatively affect metals, which are widely employed in carry trade and collateral-financing.
Need a hand to start trading: Free Guides
GOLD TECHNICAL ANALYSIS – Weekly chart below shows gold price ascending past the highs of October to levels last seen in May 2015. A clean break about this resistance level would bring gold back up to the consolidation area during the first half of 2015, with a cap at 1232.4. Strong upward momentum keeps gold firmly in overbought territory
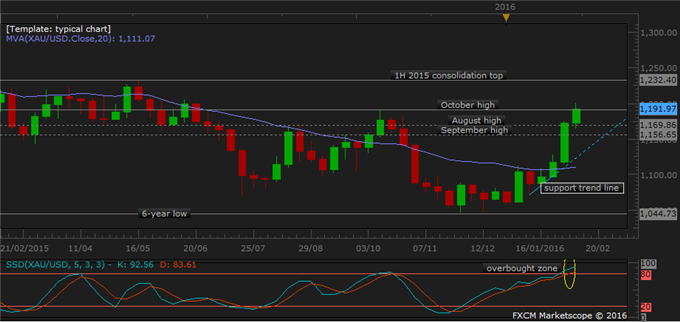
Daily Chart - Created Using FXCM Marketscope
COPPER TECHNICAL ANALYSIS – Copper price traded sideways above the support trend line and below 2.1485 resistance level on a fourth day. No big movement is expected this week while liquidity dries up. Range traders should prepare for any reversal ahead of resistance.

Daily Chart - Created Using FXCM Marketscope
CRUDE OIL TECHNICAL ANALYSIS – WTI oil price set on a consistent decline toward a recent multi-year low at 27.55. Fortunately momentum signals are approaching the lower boundary, which may lead to a slowdown if not a reversal from there on. Traders should position stop loss near 29.25 and 27.55 levels.

Daily Chart - Created Using FXCM Marketscope
--- Written by Nathalie Huynh, Currency Strategist for DailyFX.com
Want to read market’s momentum: Speculative Sentiment Index
Losing Money Trading Forex? This Might Be Why.
Contact and follow Nathalie on Twitter: @nathuynh


