


Japanese Yen, USD/JPY, Fed, Jackson Hole, Nikkei 225 – Asia Pacific Market Open
- Japanese Yen Sinks as US Dollar gains over the past 24 hours
- Dovish Bank of Japan a hindrance to JPY after Jackson Hole
- Nikkei 225 pulling back ahead of this week’s US jobs report

Monday’s Market Recap – Japanese Yen Sinks as US Dollar Gains
The Japanese Yen was the worst performing G10 currency against the US Dollar on Monday, mostly building on fundamental themes that weakened it last week. It was a quiet 24 hours given a lack of prominent economic event risk. This allowed traders to digest and continue repositioning themselves in the wake of the annual Jackson Hole Economic Symposium.
On Friday, Federal Reserve Chair Jerome Powell continued to double down on the message of fighting the highest inflation in 40 years. He also told the world that there might be some economic pain involved in doing so. As a result, the markets boosted hawkish policy expectations, continuing to eat away at pivot forecasts for 2023.
This brings us back to the Japanese Yen. At this point, the Bank of Japan is the lone standout amongst its G10 counterparts as a dove. Given that markets focused last week on a more hawkish Fed, this left JPY vulnerable. Moreover, Asia-Pacific markets were offline during Jackson Hole. Most of USD/JPY’s rise on Monday occurred during the APAC trading session as regional investors likely caught up with the news.
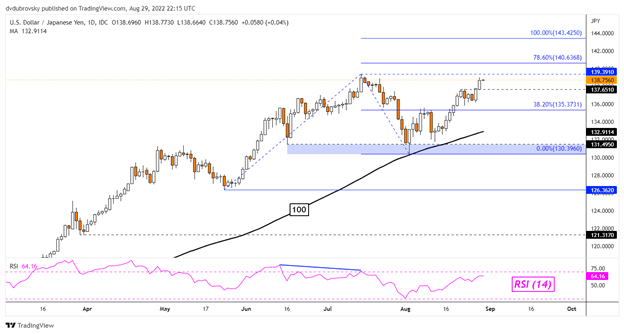
USD/JPY Technical Analysis – Daily Chart
USD/JPY closed at its highest since the middle of July on Monday, taking out the 137.65 resistance point. That has brought it within inches of the current 2022 high of 139.391. This point stands as key resistance. Taking it out would open the door to resuming the dominant uptrend towards the 78.6% Fibonacci extension at 140.63. Otherwise, key support appears to be at the 38.2% level at 135.37.

Tuesday’s Asia Pacific Trading Session
Much like Monday, Tuesday has little key economic event risk coming for the Asia-Pacific trading session. This would likely place traders focusing on general risk appetite and perhaps positioning themselves ahead of Friday’s US jobs report. More signs of a tight labor market could underpin hawkish Fed policy bets, placing the US Dollar in a favorable position. That may also not bode well for sentiment, leaving the Nikkei 225 at risk.
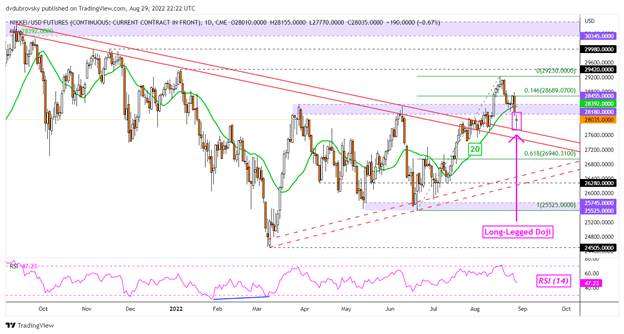
Nikkei 225 Technical Analysis – Daily Chart
On the daily chart, Nikkei 225 futures have pulled back about 4.1% from the August 17th high (29230). Prices confirmed a breakout under the 20-day Simple Moving Average (SMA). But, a Long-Legged Doji candlestick pattern was left behind. This is a sign of indecision as prices retest the former falling trendline from September 2021. As such, key support seems to be immediately below. This may offer an opportunity to bounce back. Otherwise, further losses could open the door to extending the drop. Such an outcome places the focus on the 61.8% Fibonacci retracement level at 26940.

--- Written by Daniel Dubrovsky, Strategist for DailyFX.com
To contact Daniel, use the comments section below or @ddubrovskyFX on Twitter


