


New Zealand Dollar, NZD/USD, Travel Ban, China Credit, Gold - Talking Points
- New Zealand Dollar weakness may continue into the weekend
- Traders on the watch for China credit data and Hong Kong GDP
- NZD/USD technicals ready to weaken further ahead of SMA cross

The New Zealand Dollar fell to its lowest level since June 01, 2020, versus the US Dollar amid a volatile overnight session on Wall Street. The benchmark S&P 500 index traded down well over 1% before trimming losses and finishing the day nearly in the green. Other risk assets like Bitcoin exhibited similar behavior. That may indicate that sentiment has bottomed in the short term, although traders may become more cautious going into the weekend.
New Zealand’s Performance of Manufacturing Index fell to 51.2 in April from 53.8 in March, according to BusinessNZ. NZD/USD was little changed on the news. The Kiwi Dollar has been dragged lower by falling commodity prices as well as the broader risk-off move throughout markets. However, bright signs are emerging for the domestic economy after the government announced, on Wednesday, that it plans to fully reopen the country to travel at the end of July. The move also seeks to attract skilled labor.
Today, APAC traders are looking out for an April update on China’s credit conditions. Analysts expect to see new Yuan loans fall to 1.51 trillion from 3.13 trillion Yuan. USD/CNH rose to its highest level since September 2020. The Chinese currency has also declined in recent weeks against its other major peers, which removes the narrative that US Dollar strength alone is responsible for the weakness. The main culprit behind that weakness is likely the ongoing Covid lockdowns across major cities.
Gold prices fell, likely as a result of producer price index (PPI) data out of the United States. The US PPI index rose to 11.0% in April, beating the 10.7% consensus estimate. Real yields rose after the data crossed the wires, increasing the opportunity cost for gold investors. Meanwhile, silver prices fell through a key support level. RBA Deputy Governor Michele Bullock is set to speak today, and traders will also be watching the wires for a final reading on Hong Kong’s first-quarter GDP growth rate.
NZD/USD Technical Forecast
NZD/USD continues to plummet against a risk-averse market backdrop. Prices have now fallen for the past seven weeks, with much of that downside contained within a descending channel. The 50-day Simple Moving Average (SMA) looks to be on track to cross below its 100-day SMA, a bearish sign. A near-term relief rally may be in order, but the technical posture doesn’t look hopeful for a sustained rally.
NZD/USD Daily Chart
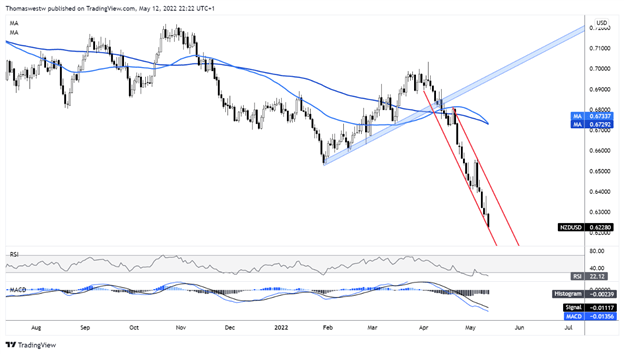
Chart created with TradingView
Trade Smarter - Sign up for the DailyFX Newsletter
Receive timely and compelling market commentary from the DailyFX team
--- Written by Thomas Westwater, Analyst for DailyFX.com
To contact Thomas, use the comments section below or @FxWestwater on Twitter


