


Australian Dollar, AUD/USD, Chinese Yuan, CPI, PPI, RBA - Talking Points
- Australian Dollar may benefit from a pullback in geopolitical tensions
- Chinese inflation and factory-gate prices eyed after traders go risk-on overnight
- AUD/USD eyes the 50-day SMA as bulls fight to extend monthly gains

Wednesday’s Asia-Pacific Outlook
The risk-sensitive Australian Dollar gained versus the US Dollar and most of its major peers overnight after tensions on the Ukrainian border cooled, spurring risk-on flows during the US trading session. The high-beta Nasdaq-100 Index (NDX) lead the charge higher in New York, closing 2.47% higher, its best daily gain since January 31.
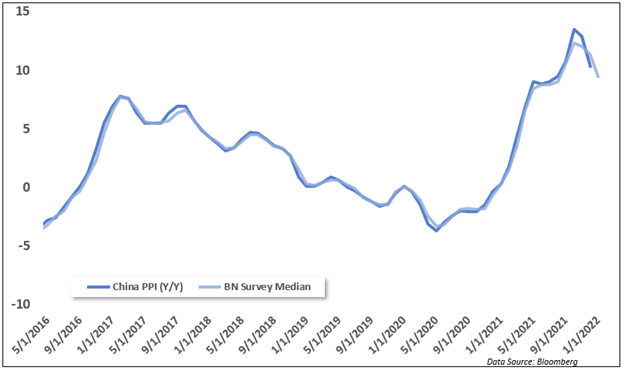
Outside of monitoring the ongoing situation in Eastern Europe, traders are watching out for Chinese data on inflation and factory-gate prices due out at 01:30 GMT. China’s January consumer price index (CPI) is expected to drop to 1% y/y from December’s 1.5%. Factory-gate prices – measured by the producer price index (PPI) – are also expected to ease, with analysts forecasting a 9.5% y/y print versus 10.3% in December.
The Chinese Yuan gained nearly half a percent against the Greenback overnight, and USD/CNH is closing in on its 2022 low at 6.3237 set in January. The Yuan’s strength comes despite diverging monetary policies between China and other major central banks. The Federal Reserve is looking at a possible 50 basis point liftoff in March while the PBOC has signaled it will move to resume pro-growth policies.
Chinese policy makers cut the one-year and five-year loan prime rates in January from 3.8% to 3.7% and 4.65% to 4.60%, respectively. Meanwhile, the rate differential premium between Treasuries and Chinese sovereign bonds is diminishing. The spread between the two countries’ 10-year yield hit its lowest since April 2019. That hasn’t deterred CNH’s advance, however. The country’s strong trade surplus is likely owed for that.

Japan will see a December update to its tertiary industry index, expected to cross the wires at a m/m pace of 0.3%, according to a Bloomberg survey. Chinese vehicle sales (Jan) are due out this afternoon, and Indonesia is set to report its fourth-quarter property price index. The Reserve Bank of Australia’s Deputy Governor Guy Debelle and Assistant Governor (Financial System) Michele Bullock will speak before the Senate Economics Legislation Committee today.
Australia’s Westpac Leading Index rose 0.13% m/m from an upwardly revised 0.0% figure in December. Aussie-Dollar traders are awaiting January jobs data later this week when analysts expect to see no change in employment from the prior month. The RBA is holding firm on its relatively dovish outlook compared to a much more aggressive rate hike outlook from market participants. While the RBA’s unemployment target has already been achieved, a stronger-than-expected print would likely firm up rate hike bets. That may send AUD/USD higher.
AUD/USD Technical Forecast
AUD/USD rose above the pseudo 50% Fibonacci retracement overnight, but bulls failed to bring prices above the 50-day Simple Moving Average (SMA). A move higher would bring the 61.8% Fib up for a test, with a descending trendline from the October swing high presenting the next potential challenge. Alternatively, a reversal lower may see the 38.2% Fib off a level of support. Overall, a slight bullish bias looks to be present as the Relative Strength Index (RSI) and MACD oscillators improve marginally.
AUD/USD Daily Chart
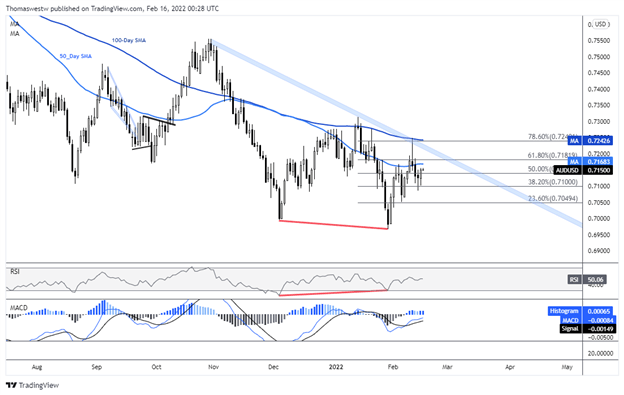
Chart created with TradingView

--- Written by Thomas Westwater, Analyst for DailyFX.com
To contact Thomas, use the comments section below or @FxWestwater on Twitter


