


US Inflation, Rotation Trade, NZD/USD, AUD/NZD -Talking Points
- US inflation data flops, pushing the Dow Jones higher while Nasdaq falls
- Treasury yields move lower despite impending $1.9 trillion stimulus package
- NZD/USD, AUD/NZD face technical obstacles with trendlines in focus

The Dow Jones Industrial Average (DJIA) closed above 32,000 for the first time after rising 1.46% on Wednesday as market optimism extended from Tuesday’s session. The S&P 500 and small-cap Russell 2000 followed suit, rising 0.60% and 1.81%, respectively. Technology stocks stepped back after Tuesday’s impressive surge, with the Nasdaq 100 dropping 0.33%.
Equity prices were supported by falling Treasury yields following a softer-than-expected US inflation report. US CPI increased at 1.7% on a yearly basis for February, as expected. However, core inflation – which excludes more volatile items like food and energy – rose only 0.1% on a month-over-month basis, missing analysts’ expectations of 0.2%.
The closely watched 10-year Treasury yield pulled back on the softer core inflation reading, extending its decline from Tuesday. Inflation expectations remain healthy, however, bolstered by the recent legislative progress of President Joe Biden’s $1.9 trillion Covid relief package, expected to be signed into law on Friday.
Dow Jones Industrial Average, 10-Year Treasury Yield – 15 Minute Chart
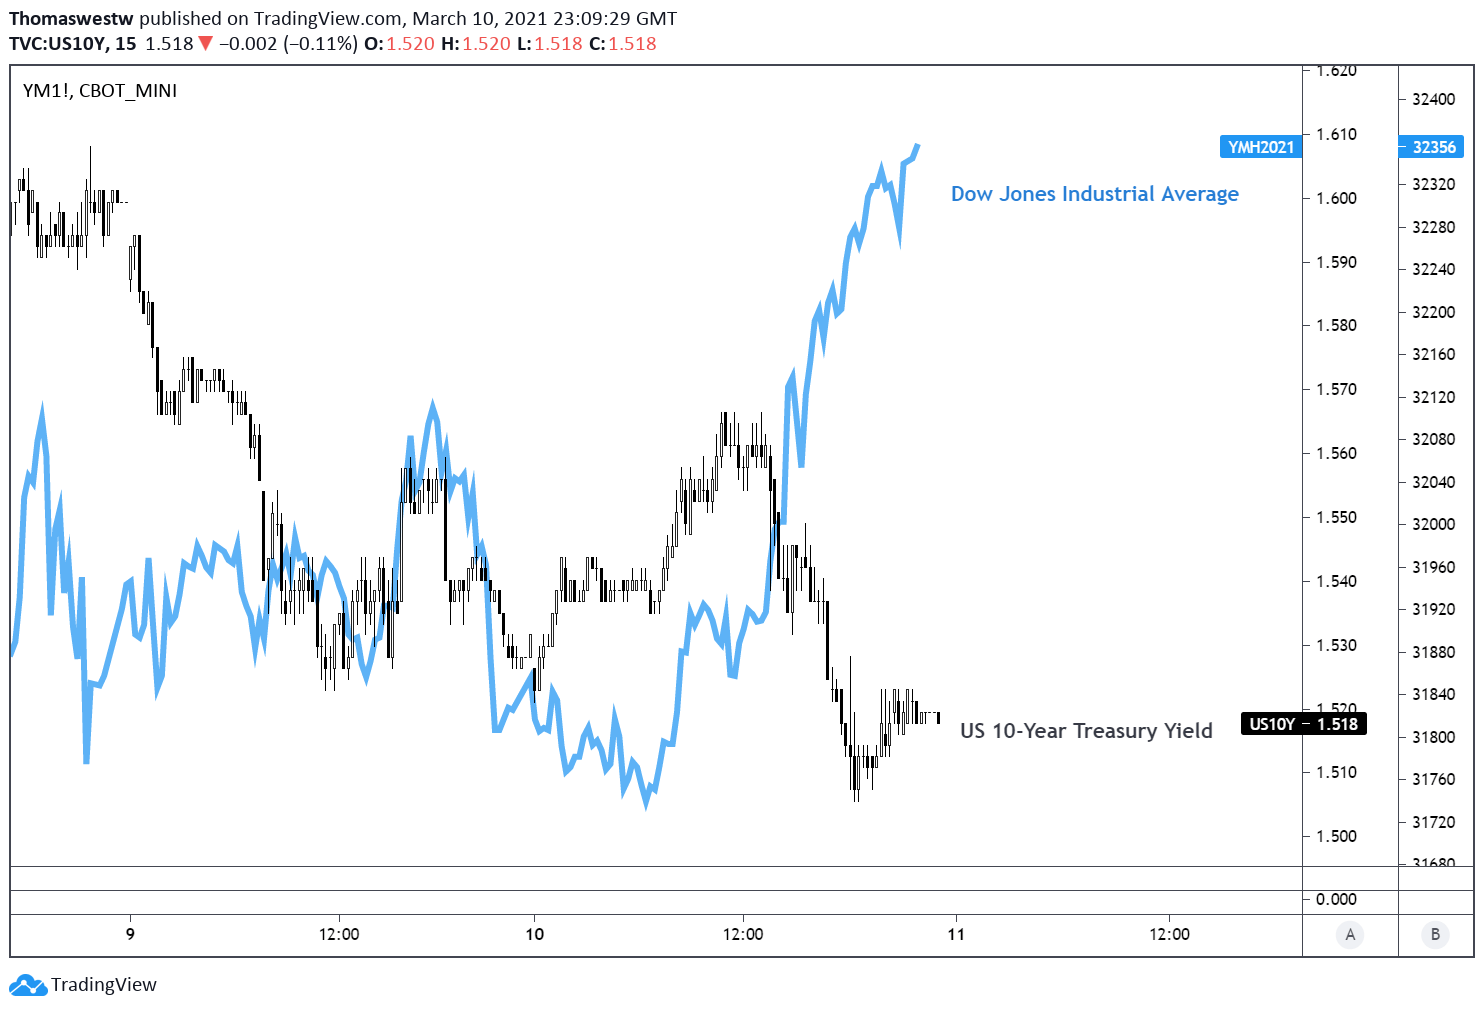
Chart created with TradingView
Thursday’s Asia-Pacific Outlook
Asia-Pacific markets are looking at a quiet open when equity markets may lean toward a risk-on stance. Currently, Hang Seng futures are pointing to a slightly higher open following Wednesday’s session when the Hong Kong index gained 0.47%. Mainland China’s CSI 300 Index moved higher by 0.66%. A report from Bloomberg citing people familiar with the matter suggests that the government is helping to stabilize equity prices by purchasing equities through a state-backed fund known as the “national team.”
The economic calendar for Thursday’s session is on the lighter side, but Australia will release data on new home sales and consumer inflation expectations, according to the DailyFX Economic Calendar. Early Friday morning will also see New Zealand release business PMI figures. Stronger inflation expectations out of Australia may help spur some Aussie-Dollar strength.

NZD/USD Technical Outlook
A weaker US Dollar is helping lift NZD/USD towards a recently surrendered trendline that gave way earlier this month. The cross pushed over the 61.8% Fibonacci retracement level from the December to February move. The trendline remains a focus for bulls to recapture longer-term bullish momentum. However, the MACD oscillator remains bearishly postured, although the signal is losing strength, evidenced by the rising histogram.
NZD/USD Daily Chart
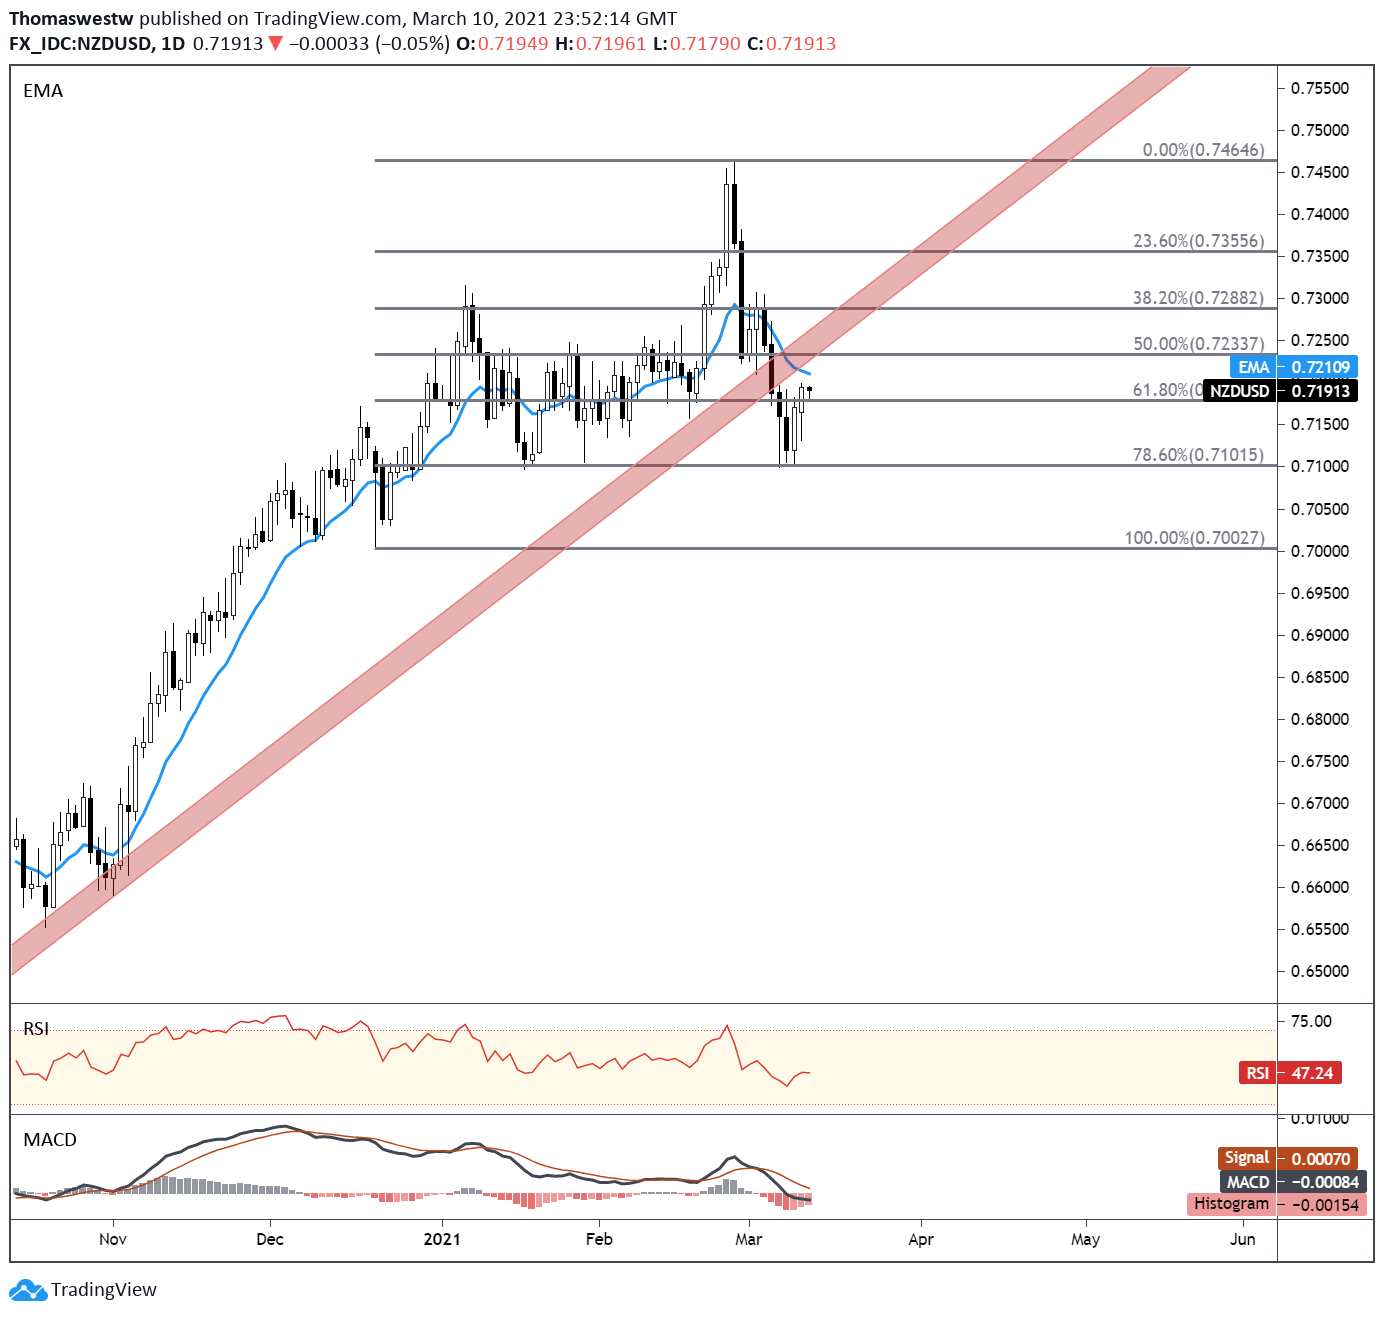
Chart created with TradingView
AUD/NZD Technical Outlook
The New Zealand Dollar may weaken against the Australian Dollar in the near term after the 20-Day Simple Moving Average (SMA) made a bullish cross over its 200-Day SMA last week. However, the 78.6% Fibonacci retracement from the January – February move along with a descending trendline from the August 2020 swing high may provide resistance, capping potential upside. Alternatively, a move lower may see support at the 20-Day SMA and 61.8% Fib level.
AUD/NZD Daily Chart

Chart created with TradingView
AUD/NZD TRADING RESOURCES
- Just getting started? See our beginners’ guide for FX traders
- What is your trading personality? Take our quiz to find out
- Join a free webinar and have your trading questions answered
--- Written by Thomas Westwater, Analyst for DailyFX.com
To contact Thomas, use the comments section below or @FxWestwater on Twitter


