


Nasdaq 100, China CSI 300, NZD/USD -Talking Points
- Nasdaq 100 surges back from correction territory as Treasury yields recede
- China’s CSI 300 moves lower despite reports of state-funded support
- NZD/USD moves higher as the Kiwi takes aim at recapturing a major trendline

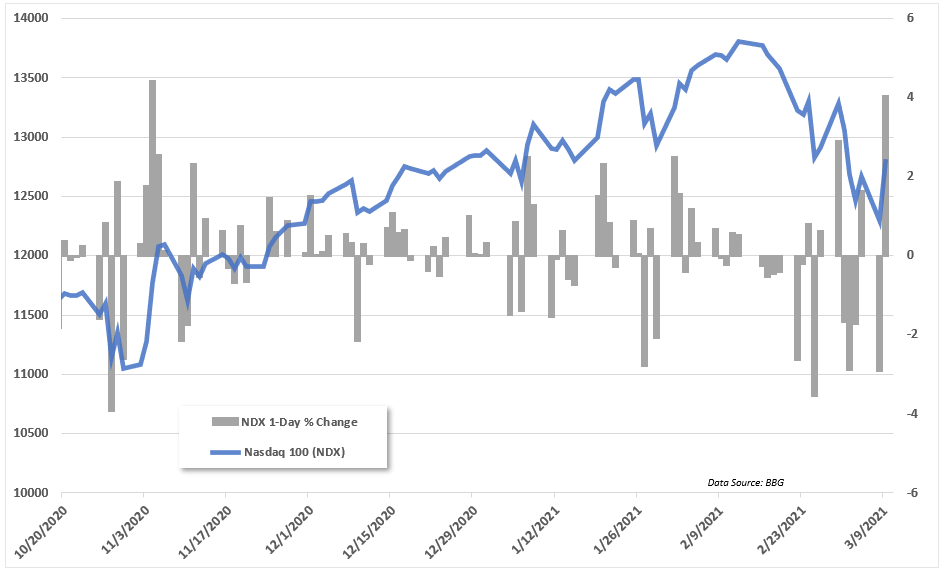
US technology stocks rebounded on Tuesday after a rough start to the week when the Nasdaq Composite sank into correction territory. Tesla rose nearly 20%, helping the Nasdaq 100 index to close over 4% higher in its best performance of the year. The Dow Jones Industrial Average, S&P 500 and Russell 2000 moved higher as well, closing +0.10%, +1.42% and 1.91%, respectively.
While Tuesday’s tech rally saw optimism surge back in high-flying names like Tesla, the Nasdaq Composite remains nearly 8% off its recent highs. Meanwhile, the Dow Jones has benefited from the rotation away from high-beta stocks as investors reallocate their portfolios as Treasury yields rise. The ten-year Treasury yield fell nearly 5% Tuesday, likely prompting some of the confidence in tech stocks.
Investors will have their eyes on inflation data out of the United States set to cross the wires Wednesday morning, according to the DailyFX Economic Calendar. Analysts expect a 1.7% print on a year-over-year basis – which will account for a 0.3% rise from the prior month. Rising energy prices are one of the reasons for the higher figure. However, core inflation – which excludes energy and other volatile products – is expected to remain unchanged from the prior month’s 1.4% read.
Nasdaq 100 Index and Daily Percent Change
Wednesday’s Asia-Pacific Outlook
Asia Pacific markets look set to open slightly higher as the pullback in Treasury yields helps to cool portfolio reallocations across the global macro investing landscape. Hong Kong’s Hang Seng Index (HSI) climbed 0.81% higher on Tuesday while Japan’s Nikkei 225 index rose nearly 1%. Australia’s ASX 200 closed 0.47% higher.
However, Chinese stocks may lag their regional counterparts after mainland China’s CSI 300 Index failed to move higher even after reports indicated that state-backed funds began purchasing equities to help prop up the index. Beijing has a track record of intervening in markets and may continue to do so if their recent actions don’t bring the desired effects. The CSI 300 is more than 16% lower from its February swing high. China is expected to release February inflation data during today’s session.
Elsewhere, the risk-sensitive Australian and New Zealand Dollars are moving higher against the Greenback, reflecting the uptick in global sentiment. Market optimism has risen to a point where rate expectations are detaching significantly from central bank expectations in Australia. Reserve Bank of Australia (RBA) Governor Philip Lowe said early Wednesday that market and RBA rate hike expectations are out of line and that it is “very likely” that the cash rate will remain at 0.1% until 2024.

NZD/USD Technical Outlook
Despite the recent move higher, NZD/USD remains below a major trendline that was breached last week. Resistance from the 61.8% Fibonacci retracement level from the December – February move also appears to be providing resistance. Currently, the Relative Strength Index (RSI) is neutrally positioned just below the 50 mark.
A break above the Fib level may likely open the door for prices to test the trendline – which may serve as an area of resistance going forward. A break lower would see the 78.6% Fib and 100-day Simple Moving Average come into focus. The MACD oscillator is skewed to the bearish side but appears to be moderating, evidenced by the histogram rising back toward the center line.
NZD/USD Daily Chart
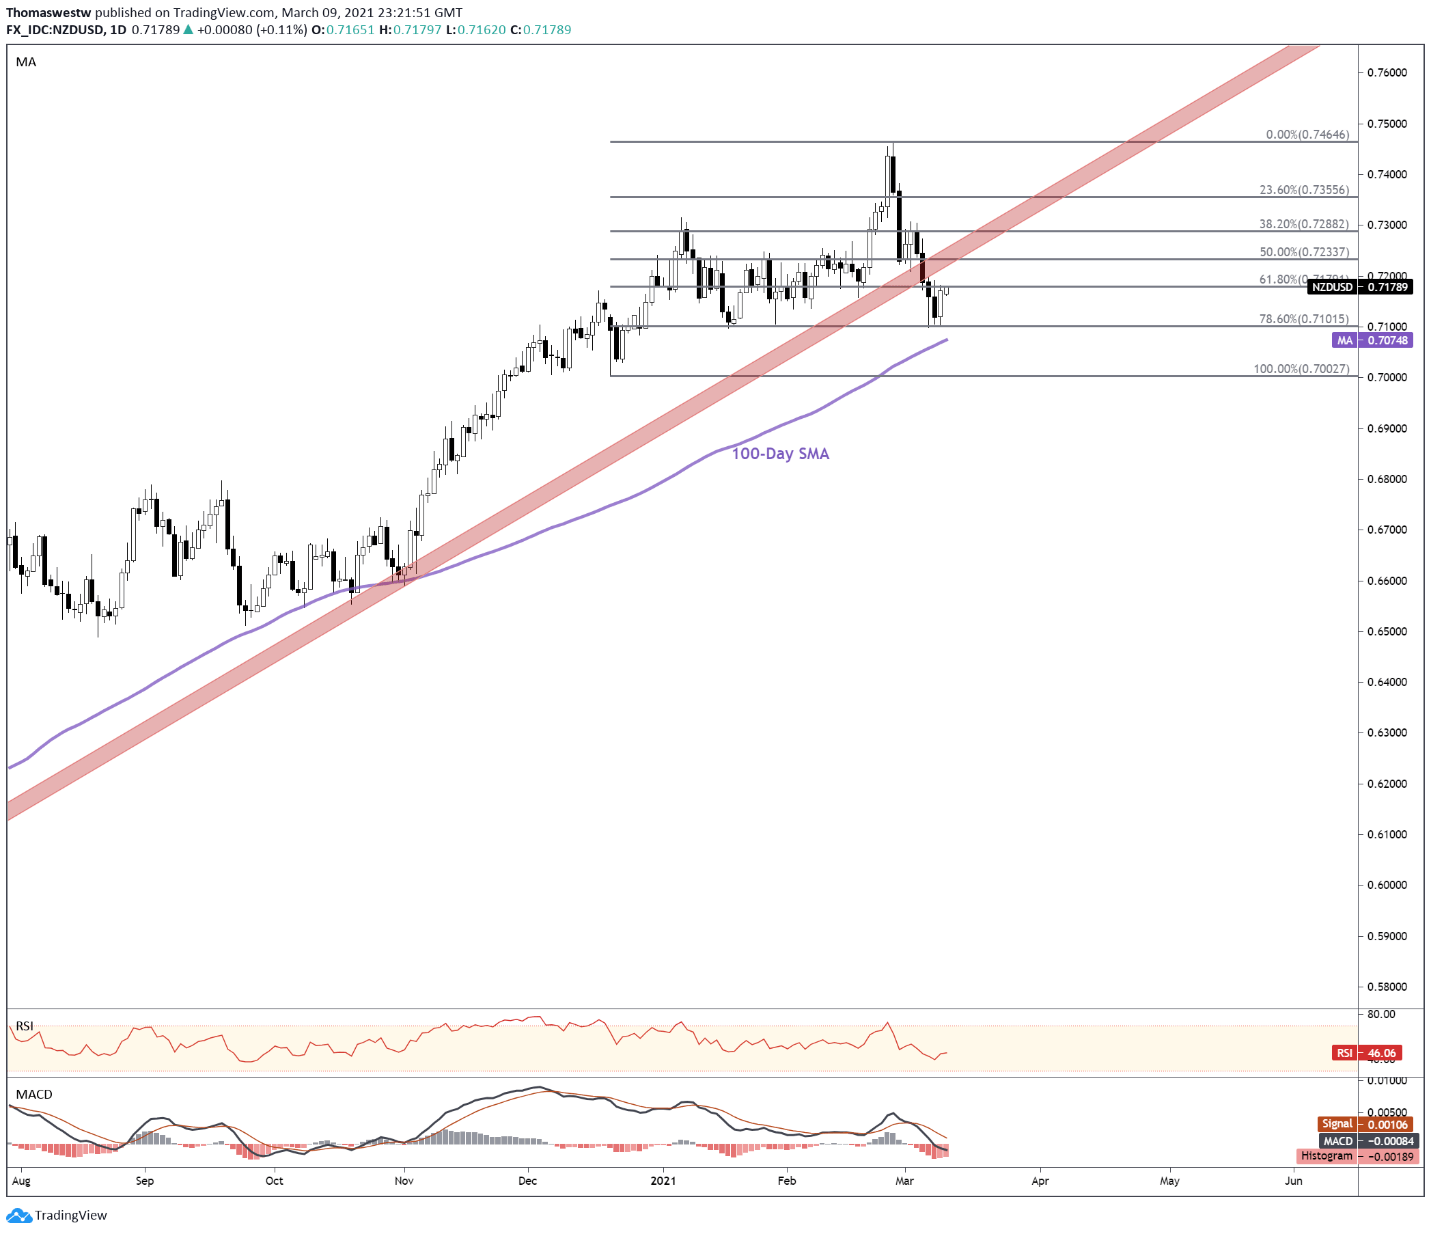
Chart created with TradingView
NZD/USD TRADING RESOURCES
- Just getting started? See our beginners’ guide for FX traders
- What is your trading personality? Take our quiz to find out
- Join a free webinar and have your trading questions answered
--- Written by Thomas Westwater, Analyst for DailyFX.com
To contact Thomas, use the comments section below or @FxWestwater on Twitter


