


Japanese Yen, USD/JPY, US Dollar, Fed, Dow Jones – Asia Pacific Market Open
- Japanese Yen tumbles as USD/JPY soars, but key JPY uptrend holds
- Markets were clearly “risk-on” but FOMC minutes offered a pause
- AUD/USD may rise if Australian jobs report ebbs RBA rate cut bets
Japanese Yen Tumbles as US Dollar Soars, Markets “Risk-on”
The anti-risk Japanese Yen tumbled on Wednesday amid a broadly optimistic day in equities across the world. The Nikkei 225, DAX 30 and Dow Jones closed 0.89%, 0.79% and 0.40% to the upside respectively. At home, the US Dollar rose alongside front-end government bond yields indicating an improving outlook on the economy. As a result, USD/JPY spiked 1.37% in its best single-day performance since August.
The chirpy mood in stocks continues to reflect the markets shrugging off the downside impact of the coronavirus on global growth. China did announce a couple of measures to help deal with the Wuhan virus such as liquidity injections. During the North American trading session, rosy housing and PPI data underscored the confidence in domestic conditions. CAD rose after rosy domestic CPI data.

Market mood stalled after the FOMC meeting minutes however. The document continued to underscore the divide between dovish expectations and a more “neutral” tone from the central bank. The Fed anticipates that during the first half of this year, the balance sheet would moderate as outstanding repos decrease over time. An unwinding of its repurchasing operations is arguably a downside risk for sentiment.
Given the aggressive drop in the Japanese Yen, it should be noted that the dominant uptrend in JPY as a whole is still intact. Using my majors-based Yen index – which averages its performance against USD, AUD, GBP and EUR – rising support from 2018 has yet to be tested. There may be room for near-term weakness which could take Yen prices on average to lows from January and December.
Majors-Based Japanese Yen Index Weekly Chart

Chart Created Using TradingView
Thursday’s Asia Pacific Trading Session – Australian Dollar, AUD/USD, AU Jobs Report, Yen
Top-tier event risk during Thursday’s Asia Pacific trading session is arguably the Australian jobs report. Data outcomes from the country have been tending to surprise to the upside as of late. More of the same from upcoming local employment data could undermine RBA rate cut bets. This is as AUD/USD struggles to clear key support with ominous signals of fading downside momentum.
Asia Pacific equities may follow the rosy lead from Wall Street which would likely bode ill for the anti-risk Japanese Yen. Given the US Dollar’s relatively high yield, it is benefiting from the risk-on tone in markets from a carry perspective. That is consequentially sapping some of the appeal of the “pro-risk” Australian Dollar and similarly-behaving New Zealand Dollar.
Japanese Yen Technical Analysis
USD/JPY closed at its highest since early May as the currency pair swiftly took out the January high followed by peaks from late May. That has left JPY facing the next critical psychological barrier which is a range between 112.30 to 111.92. The latter consists of highs from 2019. Maintaining the uptrend in the medium-term is rising support from August – red line below.
| Change in | Longs | Shorts | OI |
| Daily | 6% | 1% | 2% |
| Weekly | -8% | 5% | 2% |
USD/JPY Daily Chart
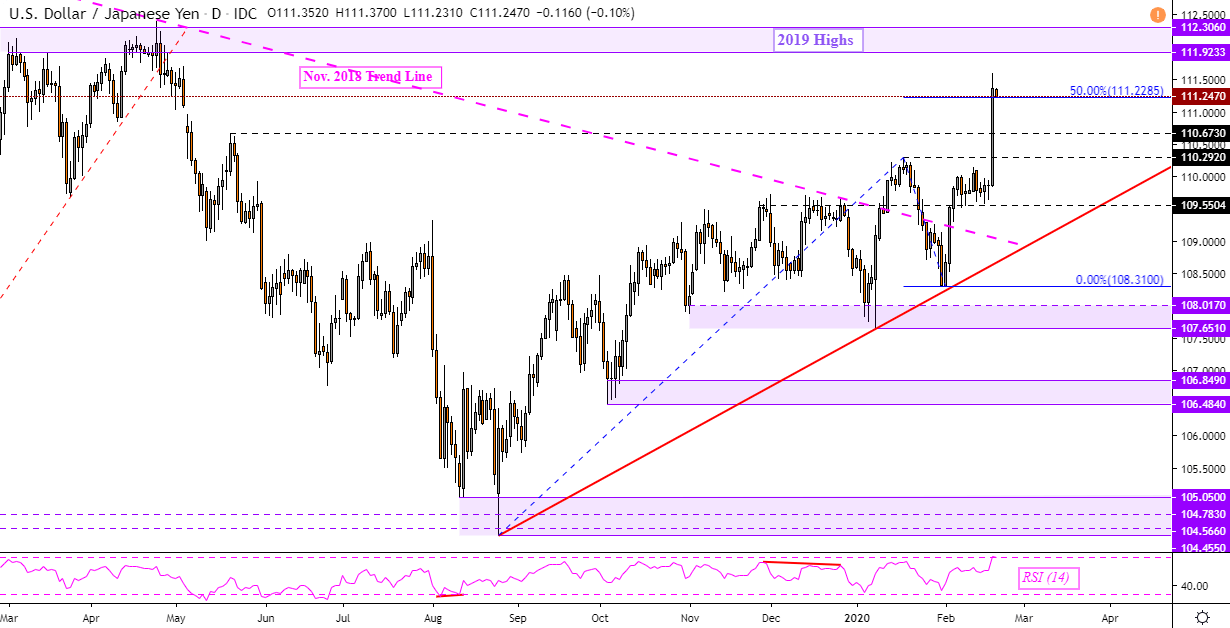
Chart Created Using TradingView
--- Written by Daniel Dubrovsky, Currency Analyst for DailyFX.com
To contact Daniel, use the comments section below or @ddubrovskyFX on Twitter


