
- Forex volatility risks tumble following lackluster US Nonfarm Payrolls report
- Our focus shifts to lower-volatility trading systems
- Keep an eye on the Dow Jones FXCM Dollar Index near key support for next clues
The US Dollar continues to stick to a tight range versus the Euro, Japanese Yen, and other major counterparts. When could we see an important break?
Relatively limited FX event risk in the week ahead suggests traders may have to wait for bigger currency swings. And indeed, last week’s US Nonfarm Payrolls report failed to force sustained volatility as market attention shifts to the US Federal Reserve’s highly-anticipated September 17 meeting.
It’s possible we may have to wait until the month of September for a much larger US Dollar break; our Senior Market Strategist expects that a break below 12,050 would mean the larger move will be to the downside. Forex volatility prices have fallen noticeably as traders predict slow market moves through the foreseeable future.
Forex Volatility Prices Pull Back on Lower Risk of Large Market Moves
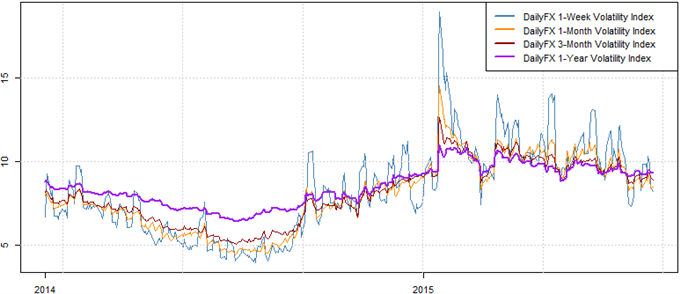
Data source: Bloomberg, DailyFX Calculations
Our focus thus turns to lower-volatility trading strategies until further notice. One key exception is the US Dollar/Canadian Dollar currency pair; high volatility prices keep our focus on the Breakout2 strategy.
See the table below for full detail on market conditions and preferred trading strategies.
DailyFX Individual Currency Pair Conditions and Trading Strategy Bias

Understand the Breakout2 Trading System via our previous article
Auto trade the trend reversal-trading Momentum2 system via our previous article.
Trade with strong trends via our Momentum1 Trading System
Use our counter-trend Range2 Trading system
--- Written by David Rodriguez, Quantitative Strategist for DailyFX.com
To receive the Speculative Sentiment Index and other reports from this author via e-mail, sign up to David’s e-mail distribution list via this link.
Contact David via Twitter at http://www.twitter.com/DRodriguezFX
Definitions
Volatility Percentile – The higher the number, the more likely we are to see strong movements in price. This number tells us where current implied volatility levels stand in relation to the past 90 days of trading. We have found that implied volatilities tend to remain very high or very low for extended periods of time. As such, it is helpful to know where the current implied volatility level stands in relation to its medium-term range.
Trend – This indicator measures trend intensity by telling us where price stands in relation to its 90 trading-day range. A very low number tells us that price is currently at or near 90-day lows, while a higher number tells us that we are near the highs. A value at or near 50 percent tells us that we are at the middle of the currency pair’s 90-day range.
Range High – 90-day closing high.
Range Low – 90-day closing low.
Last – Current market price.
Bias – Based on the above criteria, we assign the more likely profitable strategy for any given currency pair. A highly volatile currency pair (Volatility Percentile very high) suggests that we should look to use Breakout strategies. More moderate volatility levels and strong Trend values make Momentum trades more attractive, while the lowest Vol Percentile and Trend indicator figures make Range Trading the more attractive strategy.
HYPOTHETICAL PERFORMANCE RESULTS HAVE MANY INHERENT LIMITATIONS, SOME OF WHICH ARE DESCRIBED BELOW. NO REPRESENTATION IS BEING MADE THAT ANY ACCOUNT WILL OR IS LIKELY TO ACHIEVE PROFITS OR LOSSES SIMILAR TO THOSE SHOWN. IN FACT, THERE ARE FREQUENTLY SHARP DIFFERENCES BETWEEN HYPOTHETICAL PERFORMANCE RESULTS AND THE ACTUAL RESULTS SUBSEQUENTLY ACHIEVED BY ANY PARTICULAR TRADING PROGRAM.
ONE OF THE LIMITATIONS OF HYPOTHETICAL PERFORMANCE RESULTS IS THAT THEY ARE GENERALLY PREPARED WITH THE BENEFIT OF HINDSIGHT. IN ADDITION, HYPOTHETICAL TRADING DOES NOT INVOLVE FINANCIAL RISK, AND NO HYPOTHETICAL TRADING RECORD CAN COMPLETELY ACCOUNT FOR THE IMPACT OF FINANCIAL RISK IN ACTUAL TRADING. FOR EXAMPLE, THE ABILITY TO WITHSTAND LOSSES OR TO ADHERE TO A PARTICULAR TRADING PROGRAM IN SPITE OF TRADING LOSSES IS MATERIAL POINTS WHICH CAN ALSO ADVERSELY AFFECT ACTUAL TRADING RESULTS. THERE ARE NUMEROUS OTHER FACTORS RELATED TO THE MARKETS IN GENERAL OR TO THE IMPLEMENTATION.
OF ANY SPECIFIC TRADING PROGRAM WHICH CANNOT BE FULLY ACCOUNTED FOR IN THE PREPARATION OF HYPOTHETICAL PERFORMANCE RESULTS AND ALL OF WHICH CAN ADVERSELY AFFECT ACTUAL TRADING RESULTS.
Any opinions, news, research, analyses, prices, or other information contained on this website is provided as general market commentary, and does not constitute investment advice. The FXCM group will not accept liability for any loss or damage, including without limitation to, any loss of profit, which may arise directly or indirectly from use of or reliance contained in the trading signals, or in any accompanying chart analyses.