
US Dollar Outlook:
- US Treasury yields have been moving sideways after the ‘taperless tantrum’ earlier in the year, depriving the US Dollar of a needed catalyst in recent weeks.
- Volumes across the Federal Reserve’s open markets desk suggest that excess liquidity is being drained from financial markets. Is this the start of the taper?
- In simple terms, if the Fed uses repos to conduct its QE program, then reverse repos are the opposite – its tapering. But this time, it’s been a ‘tantrumless taper’.

‘To taper or not to taper? That is the question!’ Or is it? While there appears to be a nuanced, public debate occurring about whether or not the Federal Reserve should remove its stimulus and along what timeframe, it appears that the taper efforts have already begun.
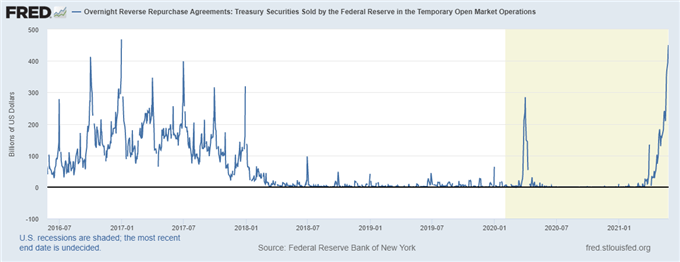
There’s been a lot of chatter in recent days about the volume of reverse repurchase agreements (RRP) at the Federal Reserve’s open market deck in recent days. In fact, on Thursday, May 27, we saw the highest volume of RRP at the Fed’s open market desk, just north of $450 billion, since December 30, 2016 ($468.36 billion).
Even in the post-Global Financial Crisis era, these kind of volumes are fairly unusual considering it’s neither the last day of the month nor the last day of the quarter.
Should traders be worried? The answer might be both yes and no.
Federal Reserve Overnight Reverse Repurchase Agreements Chart (May 2016 to May 2021) (Chart 1)
What is a Repo? What’s a Reverse Repo?
In simple terms, the Fed’s open market desk conducts repo agreements to facilitate its QE program – to add liquidity to the system. Reverse repo agreements are the opposite of QE: the Fed is draining liquidity from the system.
Here are the technical definitions, per the New York Fed. “In a repo transaction, the Desk purchases Treasury, agency debt, or agency mortgage-backed securities (MBS) from a counterparty subject to an agreement to resell the securities at a later date…repo transactions temporarily increase the quantity of reserve balances in the banking system.”
Reverse repos are the opposite: “In a reverse repo transaction...the Desk sells securities to a counterparty subject to an agreement to repurchase the securities at a later date at a higher repurchase price. Reverse repo transactions temporarily reduce the quantity of reserve balances in the banking system.”
Perspective #1 – No Problem Here
“High reverse repo volumes? No problem here! As a simple heuristic, if the Fed uses repos to implement its QE program, thereby bringing liquidity to financial markets, then high reverse repo volumes could be interpretated as a taper. And that’s a good thing! The system is well-capitalized, and high reverse repo volumes are evidence that the US economy has weathered the pandemic. This is a feature, not a bug, of the Fed’s pandemic era policies, and should be expected as normalization comes. No assets are mispriced.”
Perspective #2 – Cause for Concern
“High reverse repo volumes? This is cause for concern! This means prime brokers and certain other qualified entities are flush with capital and need a place to park it. The financial system is drowning in liquidity – this is the reason why commodities have been rallying so sharpy this year. This liquidity has contributed to high inflation, which looks more than transitory. If we saw a ‘taperless tantrum’ earlier this year, now we’re seeing a ‘tantrumless taper’. US Treasury yields are mispriced and should be higher.”
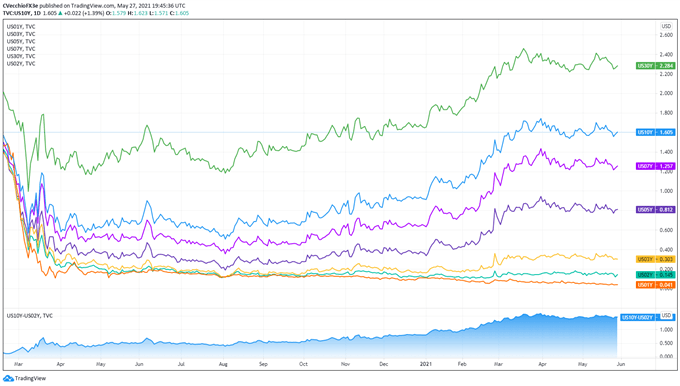
US Treasury Yield Curve (1-year to 30-years) (February 2020 to May 2021) (Chart 2)
The Trader’s Approach
Considering various Fed officials have been teasing about a timeline for taper talk, the volume of RRP is worth monitoring heading into the June Fed meeting – but that’s about it. Financial markets are barely reacting to the liquidity drain: the DXY Index is trading at the same levels it was this time last week; the US Treasury 10-year yield has been bounding in the same place for the past two-months.
DXY PRICE INDEX TECHNICAL ANALYSIS: DAILY CHART (March 2020 to May 2021) (CHART 3)
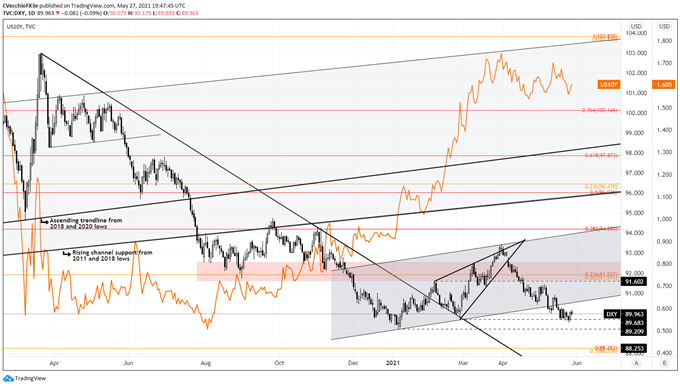
But if taper fears snowball, resulting in a kick higher in US Treasury yields, we could enter a similar trading environment akin to March, when rising yields spooked equity markets, helping the US Dollar produce a counter-trend rally amidst long-term bearish technical considerations.
--- Written by Christopher Vecchio, CFA, Senior Currency Strategist