


Talking Points:
- November has been the second-best month of the year for the USDOLLAR Index.
- EUR/USD's second-worst month of the year is November, while it’s GBP/USD’s worst.
- November marks the third of four consecutive months of gains for the S&P 500.
See the full rundown of seasonal patterns broken down by currency pairs below, and to receive reports from this analyst, sign up for Christopher’s distribution list.
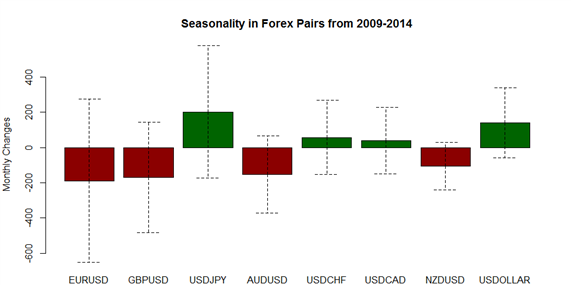
The beginning of the month warrants a review of the seasonal patterns that have influenced forex markets over the past several years. In our previous study, we decided to once again focus only on recent performance during the QE era of central bank policies (2009-present).
For November, we continue to focus on the period of 2009 to 2014; despite the Federal Reserve’s best intentions, they have yet to raise rates, so ZIRP continues. The small sample size of six years is not ideal, and we recognize that there is increased statistical stability with using longer time periods. However, because of the specific uniqueness of the past six years relative to any other time period in market history - the era of quantitative easing - we've elected to attempt to increase the stability of the estimates with the shorter time period. It’s worth noting that in future seasonality reports, we’ll begin focusing on longer-term pattern analysis to adjust as central banks attempt to normalize policy and move away from QE and ZIRP.
Forex Seasonality in Euro (via EURUSD
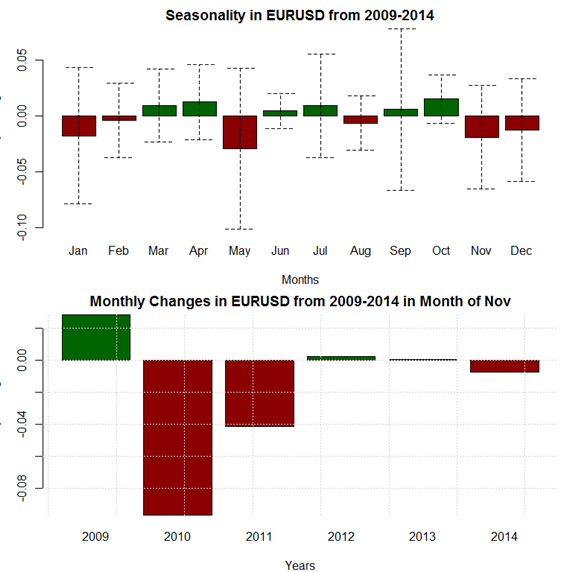
November has been the second worst month of the year during the QE era for EUR/USD. Dragged down by a severely underwhelming performance in 2010, the Euro has been the second-worst performer overall in November versus the US Dollar, only ahead of the Japanese Yen. In context of markets potentially realigning their views for the ECB to ease policy further in December and for the Fed to raise rates in December, as well as the concurrent technical continuation by EUR/USD in a seven-month long bear flag, the seasonality patterns fit neatly with the narrative for EUR/USD losses.
Forex Seasonality in British Pound (via GBPUSD)

GBP/USD’s performance in November, much like EUR/USD’s, has been underwhelming over the past six-years, although November is indeed the worst month of the year for Cable. 2013 stands out as the lone year for outperformance, and the average loss during the QE era has been -168-pips. It’s worth reporting on bond market developments at the time of writing: over the past week, the UK 10-year Gilt yield rallied from as low as 1.651% to at least 1.951%. Should Sterling rates continue to rise, GBP-crosses may be supported irrespective of seasonal trends.
Forex Seasonality in Japanese Yen (via USDJPY)

November has been the best month of the year for USD/JPY. USD/JPY is in the midst of a four-month long bull run (six out of seven through March), and recent performance bodes well: each of the past three years has produced a better performance than the one preceding it. In context of broader USD-pairs, USD/JPY may be due for a breakout, especially when factoring in the bullish S&P 500 seasonality forecast for November: price has been rangebound for the past two-months, but has recently show nascent signs of attempting to gather momentum for a topside run higher (watch the video on the other side of the link). Should a breakout occur, seasonal trends would be supportive of higher USD/JPY prices.
Forex Seasonality in Australian Dollar (via AUDUSD)

November has been the second-worst month of the year for AUD/USD, and the motto, “when it rains, it pours,” seems applicable here. AUD/USD has lost ground in four of the past six years; in those four years, the average loss was -283-pips. Given the monthly open of A$0.7115, an average bad month in context of the QE era would imply a close of A$0.6832; this seems excessive given recent market developments, and don’t foresee an immediate, precipitous plunge in risk appetite that might stoke such a move (even in an environment where markets are starting to price in a Fed rate hike in December, the backdrop of potential ECB easing ahead of any Fed decision is helping keep higher yielding and risky assets afloat). Toning down the aggressive nature of the seasonal study, AUD/USD has a modestly bearish outlook for the month.
Forex Seasonality in USDOLLAR

November has been the second-best month of the year for the USDOLLAR Index (an aggregate of EURUSD, GBPUSD, AUDUSD, and USDJPY) during the QE era. Gains have materialized for five straight years, with each of the past two years posting a better performance than the year preceding it. The strong bullish trend yields an average performance of +141-points during the QE era. Given the breakdown of the individual components of the index, we expect gains to materialize in November once again.
Forex Seasonality in New Zealand Dollar (via NZDUSD)

The seasonal forecast for NZDUSD in November is bearish. Last year produced the first month of gains during the QE era, with the preceding five all yielding losses. November’s “boom or bust” quality has been diminished in recent years; whereas the average performance in the QE era has been -105-pips, the trailing 3-year average increased to -36-pips in 2014 from -141-pips in 2013. While the extreme bearish trend may be abating, its only redeeming feature is that it only softens a rather bearish seasonal forecast for NZD/USD.
Forex Seasonality in Canadian Dollar (via USDCAD)

November has been steady in recent years, with gains in the past two and four of the past five overall. That said, an outsized loss in 2009 leaves the QE era average at only +39-pips; the rolling five-year average is +104-pips. In either case, gains have been rather limited to the topside, leaving November with a smaller trading range than October.
Forex Seasonality in Swiss Franc (via USDCHF)

November is the least bullish month of the year for USD/CHF, and it has typically invited a larger range of performance than in October. There hasn’t been a streak in either direction of more than two years in a row at any point in the QE era, if only to demonstrate a lack of conviction during the month of November. Of course, this data is somewhat skewed by the implementation of the EUR/CHF floor in September 2011; note how there is a distinct shift to depressed volatility in 2012 to 2014 relative to 2009 to 2011. While our USD/CHF seasonal forecast is bullish, now that the EUR/CHF floor is broken, a bit more volatility – resembling conditions seen from 2009 to 2011 – shouldn’t be dismissed, if not outright expected.
Forex Seasonality in S&P 500

Wasn’t ‘Sell in May and go away?’ an expression that was only supposed to last until September? September is typically a good month for stocks, but the S&P 500 fell by -2.64%. But after the first month of Q4, we’ve finally seen equity markets engage what’s been the most bullish part of the year. In October, the S&P 500 gained +8.30%, its best month in all of 2015, and its strongest single month performance since October 2011. It seems the year-end ‘Santa Claus’ rally is still very much in the cards. Q4 has been the best quarter of the year for US equities during the QE era, the average performance of +25.53-points underpins an all-around bullish seasonal forecast for the S&P 500 in November.
Forex Seasonality in Gold

The Gold-USD relationship the past few years has been fairly straightforward: as the US Dollar has strengthened since its 2011 lows, Gold has weakened dramatically from its 2011 highs. As such, in a month where the US Dollar is expected to strengthen broadly, it’s a surprise that November is expected to produce a positive performance for Gold. However, when discounting the outsized gain in 2009, and focusing on near-term trends, it’s clear that November is losing its luster a strong month for the precious metal. While the QE era average for Gold is +$18.62, the 3-year rolling average dipped to -$26.98 in 2014 from -$14.58 in 2013. Based on the above seasonality studies on the US Dollar in November, we think a neutral forecast is appropriate for Gold.
Read more: Further EUR/USD Losses Require Data Confirmation of Fed, ECB Divergence
--- Written by Christopher Vecchio, Currency Strategist
To contact Christopher Vecchio, e-mail cvecchio@dailyfx.com
Follow him on Twitter at @CVecchioFX
To be added to Christopher’s e-mail distribution list, please fill out this form


