


GOLD, XAU/USD, US DOLLAR, FED, REAL YIELDS - Talking Points
- Gold has found higher ground as the US Dollar slips across the board
- US real yields have been fairly steady at the same time, but that may change
- If US CPI surprises, Fed responses may change. Will XAU/USD be impacted?

The gold price has found support ahead of crucial US CPI on Tuesday as the market has expectations that the data will show overall easing price pressures.
Headline month-on-month CPI for August is anticipated to be -0.1% against a flat number for July and 8.1% for the year-on-year figure against 8.5% previously.
Month-on-month ex food and energy CPI is forecast to print the same as the prior month at 0.3%, with the annual read expected to be 6.1% versus 5.9% previously.
While the market is expecting a 75 basis point hike at the Federal Open Market Committee (FOMC) meeting next week, appraisals of further jumbo lifts have come under question if price pressures continue to ease.
The market's perception of a cooling in CPI has helped equity markets rally and undermined the US Dollar.
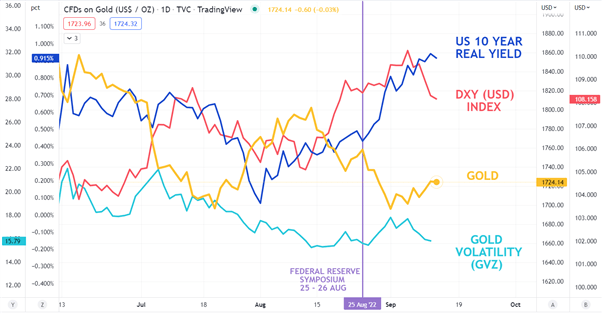
In the aftermath of the Fed’s Jackson Hole symposium, where Fed Chair Jerome Powell laid down the law on their inflation-fighting determination, US real yields initially lifted and gold slipped lower at the same time.
The last few sessions have seen real yields remain fairly steady at a time when the US Dollar has come under pressure. As shown in the chart below, it appears that the ‘big dollar’ weakness is having more impact for the time being on the gold price.
If today’s US CPI is significantly outside of expectations, it could ignite a move in real yields and that might flow into gold price movements again.
GOLD AGAINST US 10-YEAR REAL YIELD,USD (DXY) INDEX AND VOLATILITY (GVZ)
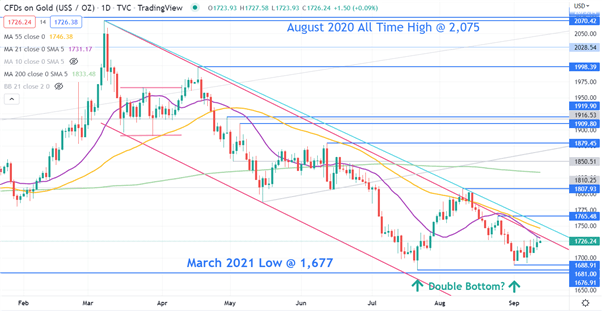
GOLD TECHNICAL ANALYSIS
In July and August, gold threatened to break below the March 2021 low of 1677 but pulled up at 1681 and 1689 respectively.
This might have set up a potential support zone in the 1675 – 1690 area.
Those two tests of the prior low appear to have created a possible Double Bottom. A move above 1808 would be needed to confirm it.
If it was to break above that level, it would have also broken above two descending trend lines. These trendlines may offer resistance and are currently dissecting at 1735 and 1750.
The 21-, 34 and 55- Simple Moving Averages (SMA) are also in that area and could add weight to resistance ahead of the recent previous peak at 1765.
Introduction to Technical Analysis
Moving Averages
Recommended by Daniel McCarthy
--- Written by Daniel McCarthy, Strategist for DailyFX.com
To contact Daniel, use the comments section below or @DanMcCathyFX on Twitter


